
While we all continue to experience the challenges and uncertainty of life during a global pandemic, financial markets appear to have found – at least in the short term – some stability. During this moment of relative calm, we believe now is an opportune time to pause and reflect on the year so far and the implications for defined benefit (DB) plan sponsors and their asset managers in the liability-driven investment (LDI) space. By examining these market swings and how different asset classes and sectors performed, investors can better plan for the balance of the year, as well as future periods of extreme volatility.
Generally, plan sponsors with LDI managers that resisted the temptation of lower quality assets were able to outperform their benchmarks at the start of the pandemic. As markets rallied, those who were nimble and more able to access liquidity benefitted from adding credit exposure at attractive spread levels.
Below we revisit market conditions before COVID-19, during the peak of market panic and today, with a focus on how certain portfolio allocations performed during this period of extreme volatility.
The calm before the storm
(January 1 - February 20, 2020)
At the beginning of 2020, the U.S. stock market continued its decade long run, posting a 31.5% return for 2019, with the S&P 500 eventually reaching its then all-time peak of 3,386 on February 19, 2020. Similarly, in credit markets, the spread on the Bloomberg Barclays Long Credit index was as tight as 1.4%, only 0.1% above the 10-year low point of 1.3% reached in February 2018. Unemployment reached a low of 3.5%, a level not seen since the 1960s. As a result, companies took advantage of the favorable economic conditions and issued $1.4 trillion of debt, up almost 7% from 2018.
Despite a contraction in spreads, this upbeat environment helped push the average pension plans funded status close to 90% at the end of 2019, roughly 10% higher than the ~80% funding ratio average five years ago.
VIX Market volatility peaked in Q1
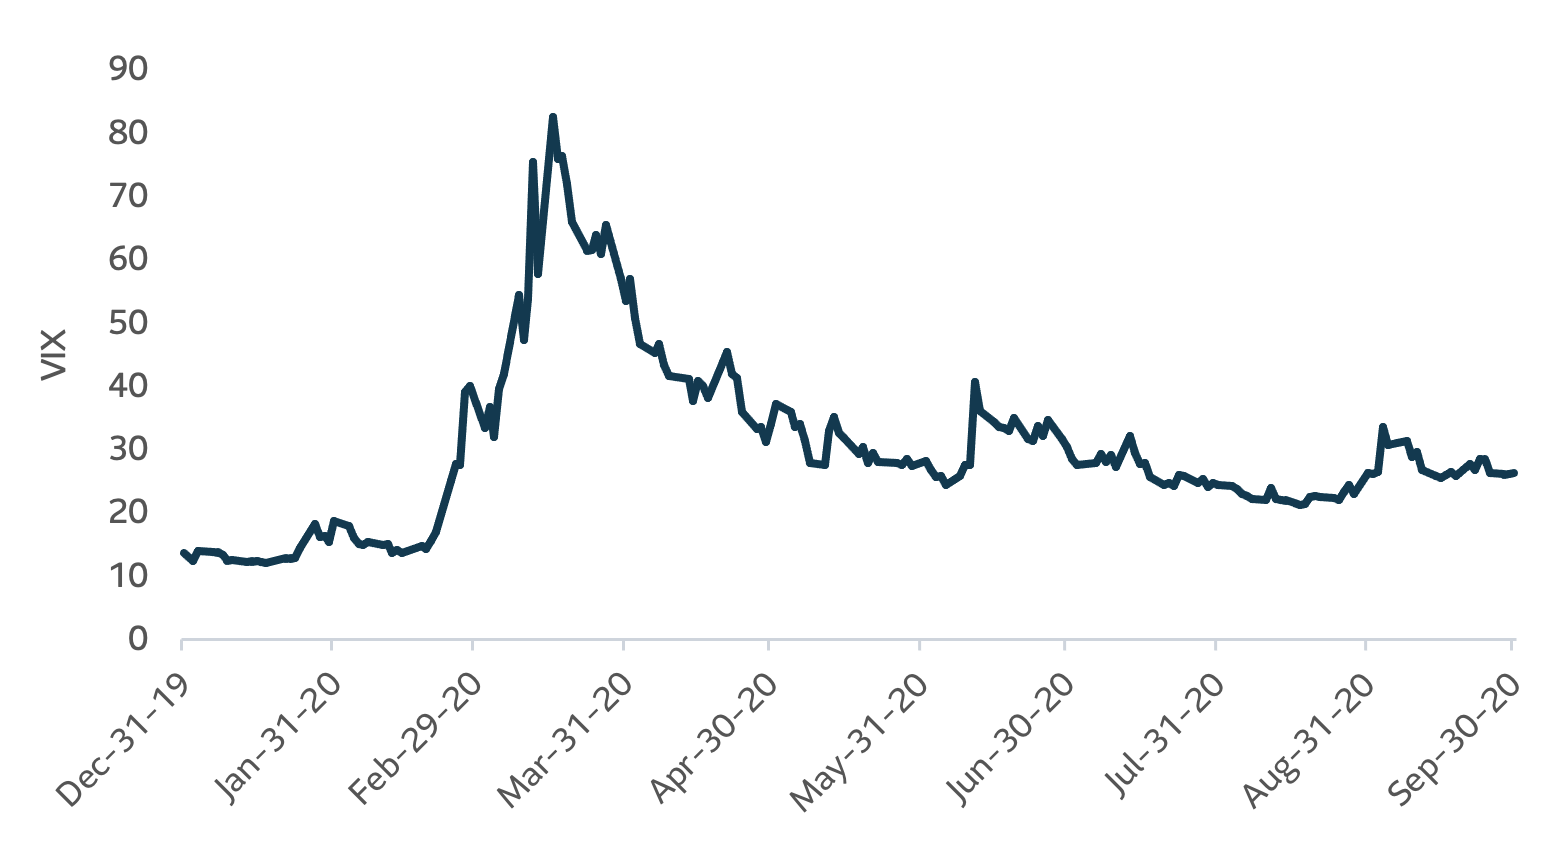
Source: Bloomberg
Implications for LDI managers
LDI managers who took on excess credit risk versus their benchmarks benefited from the additional yield available on lower quality sectors while credit risk appeared to be benign. For example, in the long duration space, the industrial sector which traditionally has higher spread beta provided an additional 0.3% in yield in 2019 relative to Long Utilities, a traditionally lower risk sector.
Onset of Covid-19 in Europe/U.S.
(February 20 - March 23, 2020)
By late February, the COVID-19 outbreak in Italy solidified fears that the impact of the virus would not be limited to China. Equity markets began to decline at an unprecedented pace. Two days after reaching an all-time high on February 19, the S&P 500 lost more than 3% on three of the next four trading days.
Markets continued to deteriorate at an even more rapid pace in March. From March 5 to 22, the S&P 500 saw losses greater than 3% on seven of the next twelve trading days, culminating with a decline of -9.5% on March 12, and another loss of -12.0% two days later. By March 23, only a month after reaching its all-time high, the S&P 500 was down 34% for the year.
Conditions were equally chaotic in the fixed income markets, as concerns over the viability of many businesses grew. Long credit spreads reached 3.6%, levels not seen since 2009. While this was not as precarious as the peak of the 2008 Global Financial Crisis (GFC), when long credit spreads reached 4.8%, it was the speed with which spreads expanded that was alarming. During the GFC, it took four months for spreads to expand by 2.2% from their lows, whereas it only took one month during the March 2020 market turmoil.
Despite this extreme volatility, it was not all bad news for the funded status of corporate DB pension plans. While equity market losses took a toll on assets, the expanding credit spreads resulted in higher liability discount rates. Overall, funding status ratios improved in March by 3.5%, mostly driven by a 0.7% increase in liability discount rates.
Market selloff timeline
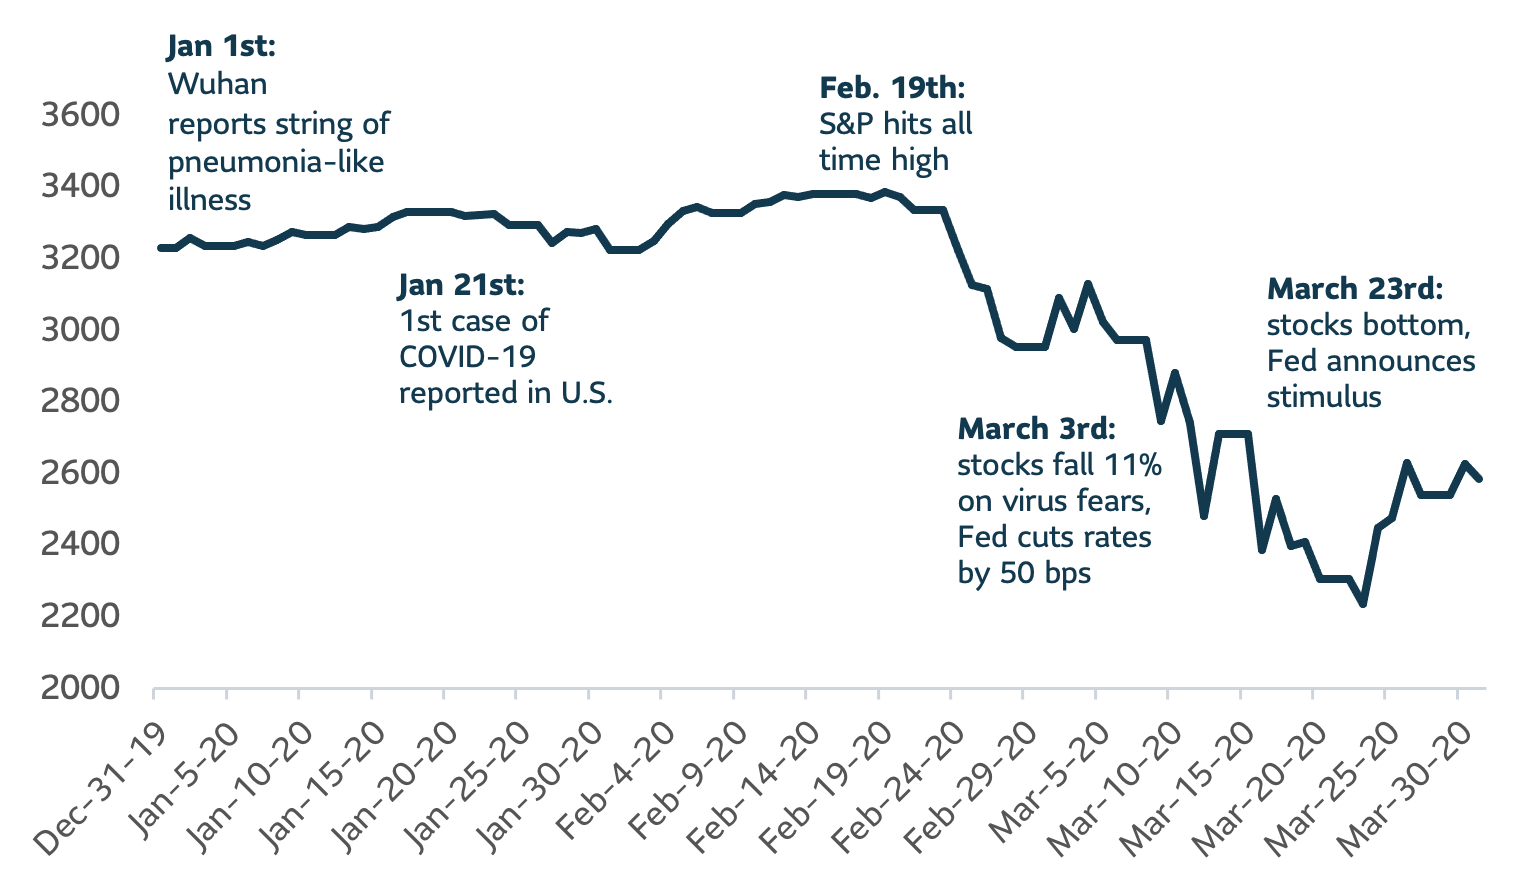
Source: Bloomberg
Implications for LDI managers
In a reversal of fortune, managers who underestimated credit risk and positioned for higher spread beta were hurt badly. In the long duration space, Industrials now lagged Utilities by 4.9% over the timeframe of February 20 – March 23. A manager who reached for yield with a 10% overweight to Industrials would have underperformed the benchmark by -0.5% over that timeframe1.
As spreads reached attractive levels towards the end of this period, managers who were able to raise liquidity – in an increasingly illiquid environment – were able to purchase issues at attractive prices.
1Assumes the 10% overweight to Industrials is offset by a 10% underweight to Utilities. All other benchmark sectors are held constant.
The return of smooth sailing or the eye of the storm?
After March 23, 2020
Lessons from the GFC spurred both the Federal Reserve and congress to take unprecedented measures in the face of the COVID-19 market crisis. In addition to the traditional rate cut, the Federal Reserve created a vast array of guarantees and lending programs to provide a backstop for investors.
These measures ranged from purchasing $700 billion of Treasuries and agency mortgage backed securities (MBS) to reviving the GFC-era Term Asset-Backed Securities Loan Facility (TALF). In addition, the Federal Reserve commenced lending directly to corporations by buying both new issue and secondary market corporate debt. This was most visible in mid-May, with the Federal Reserve purchasing corporate bonds via ETFs to successfully stabilize the market as signs of weakness appeared. Congress also passed the $2 trillion dollar CARES Act, a large stimulus package that is estimated to equal approximately 10% of GDP. To put things in context, the 2020 deficit as a percent of GDP will likely be greater than it was during the Second World War.
Despite a sharp increase in unemployment figures, these swift and decisive measures appear to have worked, fueling a robust (and remarkable) rebound in the U.S. stock market. From its lows on March 23, the S&P 500 rebounded by about 38% in a month and a half, reducing peak losses down to about 9% as of May 31. By June 30, the S&P 500 posted its best quarter since 1998, and fourth best quarter since 1950 with an astounding 20% return. In the three months since then, the S&P gained another 8.5%, reaching an all-time high of 3,580 on September 2.
Credit markets responded with similar vigour, with the spread on the Bloomberg Barclays Long Credit Index contracting to about 2.0%. Remarkably, this contraction in spreads happened despite a record volume of new issuance, as issuers took advantage of the boost in market confidence created by the Federal Reserve to lock in long term funding.
Unfortunately, for DB plans, the liquidity injection also resulted in the continual fall in Treasury yields. As a result, despite the recovery in equity markets, the average DB funded status fell from 90% at the end of 2019 to 85% at the end of September.
Active managers with access to liquidity were able to take advantage of rapid spread widening and tightening in Q1
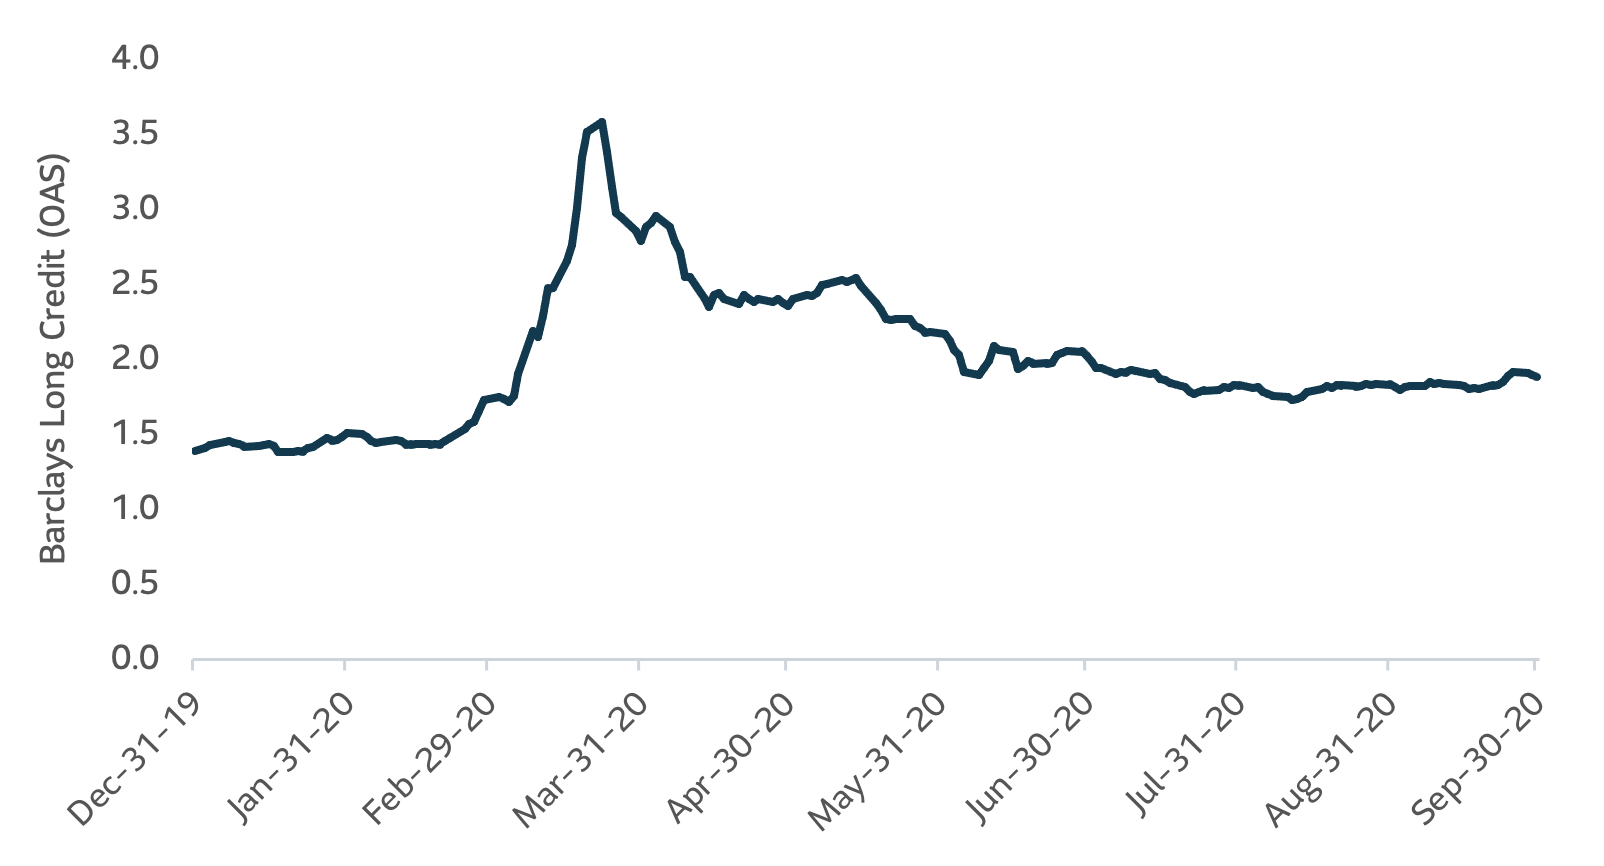
Source: Barclays live
Spreads remain tight despite IG corporate issuance hitting record levels YTD
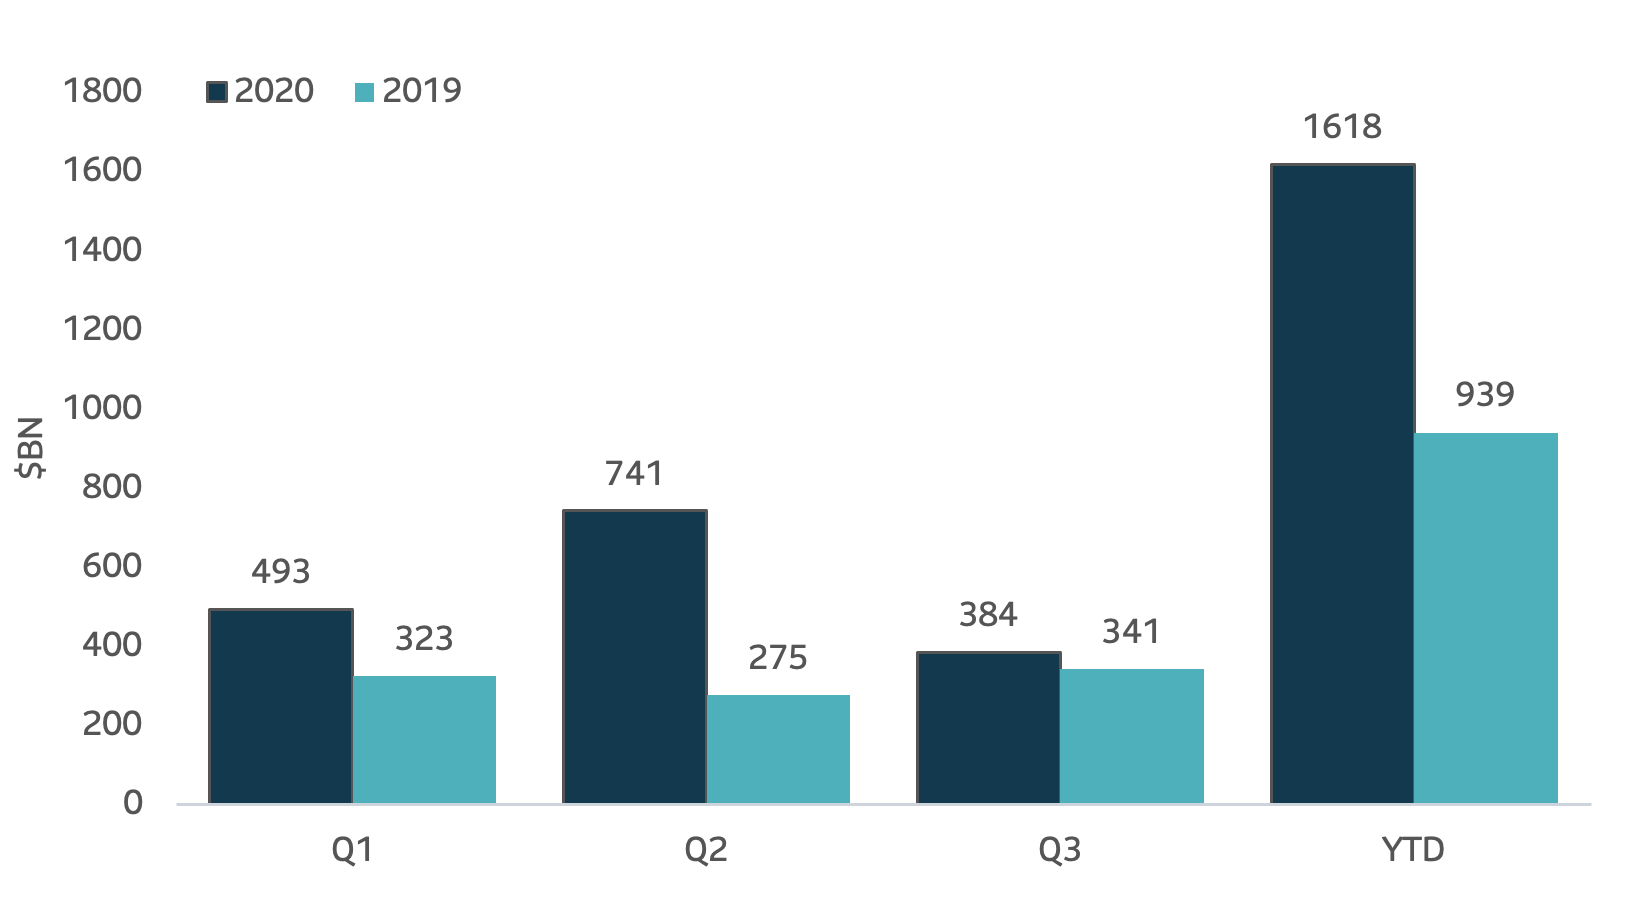
Source: SIFMA
Implications for LDI managers
The quick retracement in credit spreads meant that LDI managers who were able to access liquidity to add corporate bond exposure during March benefitted substantially. Furthermore, the quick rally increased pricing discrepancies across names and sectors. Managers who were nimble enough to take advantage of dislocations in the secondary market were able to add significant value through active security selection.
Planning for future ebbs and flows
For many plan sponsors, the recent economic and market volatility resulted in both unpredictable funded status movements and additional unforeseen business challenges. While plan sponsors who adopted an LDI framework and utilized long duration corporate bonds would have typically experienced lower volatility, there was significant dispersion in the performance of credit managers during this unprecedented period.
While we believe the primary role of the LDI portfolio is to protect funded status during these unstable periods, increased volatility also brings additional opportunities for active managers. Looking beyond the top line numbers and exploring how a manager adds alpha can help plan sponsors identify managers who do so in a way that is less correlated with the broader universe. This can help to drive performance during down markets, when plan sponsors might value it the most.
With a second stimulus bill stalled in Congress and the potential for additional volatility around November elections in the U.S., we could once again be entering a period of uncertainty. A manager’s ability to be nimble and react quickly to changing markets will be key to helping their clients navigate the turbulent waters that loom ahead. In a follow-up article, we will explain how we believe active managers can help clients achieve their investment goals in a systematic and repeatable basis throughout market cycles.
At SLC Management, we work with plan sponsors to implement LDI solutions that help them meet their liability hedging goals. We believe the primary role of the fixed income assets within the LDI framework is to protect the plan during periods of significant volatility. Our framework of systematic risk management combined with our ability to be nimble via issue selection and sector rotation allows us to outperform when our clients need us the most. As of September 30, our long credit portfolios significantly outperformed the benchmark on a year to date basis.
This paper is intended for institutional investors only. The information in this paper is not intended to provide specific financial, tax, investment, insurance, legal or accounting advice and should not be relied upon and does not constitute a specific offer to buy and/or sell securities, insurance or investment services. Investors should consult with their professional advisors before acting upon any information contained in this paper.
SLC Management is the brand name for the institutional asset management business of Sun Life Financial Inc. (“Sun Life”) under which Sun Life Capital Management (U.S.) LLC in the United States, and Sun Life Capital Management (Canada) Inc. in Canada operate. Sun Life Capital Management (Canada) Inc. is a Canadian registered portfolio manager, investment fund manager, exempt market dealer and in Ontario, a commodity trading manager. Sun Life Capital Management (U.S.) LLC is registered with the U.S. Securities and Exchange Commission as an investment adviser and is also a Commodity Trading Advisor and Commodity Pool Operator registered with the Commodity Futures Trading Commission under the Commodity Exchange Act and Members of the National Futures Association. Registration as an investment adviser does not imply any level of skill or training.
Unless otherwise stated, all figures and estimates provided have been sourced internally and are as of September 30, 2020. Unless otherwise noted, all references to “$” are in U.S. dollars.
Nothing in this paper should (i) be construed to cause any of the operations under SLC Management to be an investment advice fiduciary under the U.S. Employee Retirement Income Security Act of 1974, as amended, the U.S. Internal Revenue Code of 1986, as amended, or similar law, (ii) be considered individualized investment advice to plan assets based on the particular needs of a plan or (iii) serve as a primary basis for investment decisions with respect to plan assets.
This document may present materials or statements which reflect expectations or forecasts of future events. Such forward-looking statements are speculative in nature and may be subject to risks, uncertainties and assumptions and actual results which could differ significantly from the statements. As such, do not place undue reliance upon such forward-looking statements. All opinions and commentary are subject to change without notice and are provided in good faith without legal responsibility.
Unless otherwise stated, all figures and estimates provided have been sourced internally and are current as at the date of the paper unless separately stated. All data is subject to change.
No part of this material may, without SLC Management’s prior written consent, be (i) copied, photocopied or duplicated in any form, by any means, or (ii) distributed to any person that is not an employee, officer, director, or authorized agent of the recipient.
Past results are not necessarily indicative of future results.
© 2020, SLC Management
SLC-20221024-2460971