
Q4 2024: Investment Grade Private Credit update
Strong October issuance led to a strong fourth quarter of 2024. Meanwhile, business development companies (BDCs) continue to grow as potential opportunities for IG private credit investors.

Market statistics for the private placement market sourced from Private Placement Monitor, a standard proxy for the investment grade (IG) private credit market.
Strong October issuance led to a strong fourth quarter of 2024. Meanwhile, business development companies (BDCs) continue to grow as potential opportunities for IG private credit investors.
Market
IG private credit markets closed out 2024 with a record volume of US$125 billion in 2024, according to Private Placement Monitor, exceeding the previous record set in 2021. We saw an increased number of issuers coming to market, prompted by lower interest rates and less market volatility. This was in contrast to the “wait and see” approach some took in 2023 for their non-urgent financing needs.
Volumes of US$30.5 billion in the fourth quarter of 2024 exceeded that of the third quarter, although it was below the US$48.3 billion record volume set in the second quarter of the year. The majority of fourth quarter volume (US$18.5 billion) was issued in October as issuers tried to get ahead of any potential market disruption around the U.S. election cycle. The trend of large issuances (>US$1 billion) continued, with 19 such transactions completed in the year compared to 15 in 2023. Five deals greater than US$1 billion were issued in the fourth quarter of 2024, with the largest at US$1.28 billion in the industrial-life science and biotechnology sector. Volume growth was driven by the industrial sector, including a number of large investments in the energy sector (liquefied natural gas, pipelines, etc.), followed by the financial sector (asset managers, real estate investment trusts, etc.), utilities, and transportation.
Compared to 2023, there was a higher percentage of deals issued with mid (5–10 year) and long (>10 year) tenors, compared to shorter (<5 years) tenor deals. This was an expected impact of lower interest rates in 2024. In addition, delayed funding volume, an attractive option for private placement issuers, had a material uptick of over two times in the fourth quarter, compared to previous quarters in the year. This volume also exceeded that of the fourth quarter of 2023. This was likely due to issuers trying to avoid any price volatility post the U.S. election.
Heightened competition was a hallmark of 2024, with significant and growing demand for IG private credit from investors. Spreads on average were moderately tighter (by approximately 20 basis points) for the year compared to 2023. This was not dissimilar to the tightening seen in the public IG bond market. However, relative value compared to the public markets remained in line with historical averages. “December premiums” for spreads, typically seen at the end of the year as some investors come to the end of their investment programs, occurred in November 2024. Some of this December premium may have been due to a number of lower credit quality deals issued in November that garnered higher spreads.
Outlook
Looking to the year ahead, 2025 is poised to build on the momentum of 2024, with brokers indicating a strong pipeline of January and February deals. While the impact of geopolitical risk, further volatility in rates or inflation, and the new U.S. administration’s policies on tax, tariffs and regulation remain uncertain, the general consensus of the market is that 2025 should be an active year for corporate activity and deal flow.
SLC Management was active throughout 2024 and was able to achieve leading positions in a large number of syndicated transactions. In addition, our disciplined underwriting led to improvements in pricing and structures in several instances (source: Private Placement Monitor and SLC Management internal data). We continue our strategy of proactively leveraging our knowledge base and origination platform to generate more bilateral and bespoke transactions, areas in which there is less competition than in syndicated markets.
In focus: Growth of nontraded BDCs driven by strong private credit demand
The private credit market has seen explosive growth in recent years, with its roughly US$2T in market size at the end of 2023 approximately 10-times larger than it was in 2007 (according to U.S. Federal Reserve statistics). A significant driver of this growth has been within direct lending, which amounts to almost US$800B of AUM, roughly doubling in size since 2020. Publicly traded BDCs have been investing in direct lending for over 20 years and are regular issuers in the public and private investment grade debt markets.
However, the rise of non-traded BDCs, targeting the retail high-net-worth (HNW) channel, has marked a steep change in the market in terms of AUM and financing opportunities. Since 2021, the non-traded BDC sector now stands at almost US$250B in assets and growing. Non-traded BDC equity fundraising amounted to US$32 billion raised as of November 2024, up nearly 76% year over year. The growth of BDCs, and in particular the role of the IG private credit market in the growth of non-traded BDCs, merit closer examination of this sector.
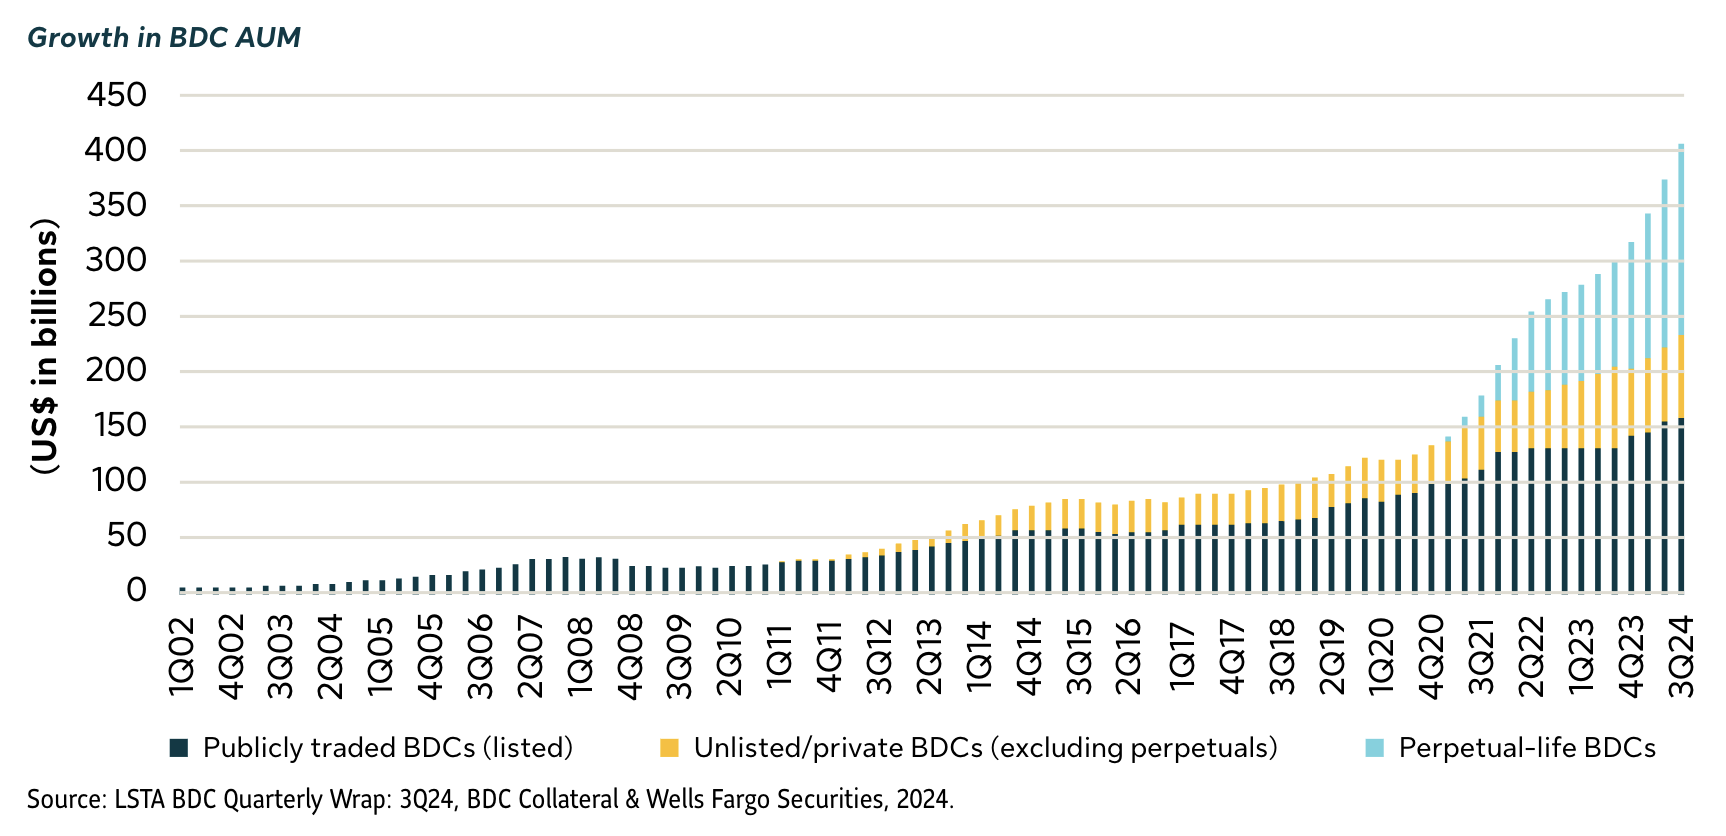
Source: LSTA BDC Quarterly Wrap: 3Q24, BDC Collateral & Wells Fargo Securities, 2024.
Unlike their publicly traded counterparts, which raise equity through IPOs, non-traded BDCs are not listed on an exchange and raise equity at net asset value on an ongoing subscription basis, typically through registered investment advisors (RIAs) and wirehouses. BDCs, regardless of type, are governed in the U.S. by the Investment Act of 1940, which permits maximum leverage of no more than two-times on a debt/equity basis, which supports a BBB/BBB- rating profile.
Strong issuance across public and private debt markets
The BDC market issued a record US$25B in 2024, almost doubling the 2021 record of US$13B. The public market for BDCs has historically been pro-cyclical and investor sentiment can shift rapidly.
The U.S. private placement (USPP) sector of the IG private credit market, in contrast, has been a consistent, reliable
and growing source of debt capital for BDCs. These BDC managers often value the direct institutional relationships in the private market. According to data compiled from Private Placement Monitor, BDC issuances in the USPP market grew from US$2.4B in 2021 to US$3.4B in 2022, and have remained consistently above US$3B in 2023 and 2024. Investors in the USPP market tend to be well compensated in terms of relative value during times of market volatility and when liquidity in the public market dries up.
Trends to watch
Looking ahead to 2025, we expect a continuation of the growth themes we saw develop in 2024. We will also continue to watch for developments within the non-traded BDC sector as the market matures. BDC issuers will likely continue to build out their credit curves, with more frequent 7-year and, potentially, 10-year issuances. Additionally, with roughly 100 players in the non-traded space, there is likely to be further dispersion and distinction in terms of credit performance (as longer track records are established) and subsequently more refined pricing and credit ratings.
BDC spreads have generally trended closer to the BB Financials index than the BBB Financials index, providing investors with opportunity for strong risk-adjusted returns. Furthermore, while the industry has long been rated almost exclusively low BBB by the big three rating agencies (Moody’s, S&P, Fitch), we are starting to see shifts here as well, with both Fitch and Moody’s upgrading several larger cap BDCs to mid BBB from low BBB.
The final development to watch, and one we believe represents continued investment opportunities in the BDC USPP market, is the upcoming maturity wall resulting from this record level of activity. In its 2025 outlook, Fitch notes the aggregate amount of debt maturing for rated BDCs will increase nearly 50% in 2025 year over year to US$7.3 billion, with US$21B in aggregate debt maturing by the end of 2026. While issuers have been proactive in reducing 2025 debt maturities with record issuance in 2024, there remains substantial issuance to come to prepare for the larger maturity wall coming in 2026.
Sources: U.S. Federal Reserve, Alternative.Investments, DI Wire, Bloomberg, Fitch Ratings, Private Placement Monitor, 2024–5.
Disclosure
© 2025, SLC Management
Any reference to a specific asset does not constitute a recommendation to buy, sell or hold or directly invest in it. It should not be assumed that any investment will be profitable or will equal the results of the assets discussed in this document. Any assets referred to herein represent investments of SLC Fixed Income, which are managed on a discretionary and non-discretionary basis for Sun Life's General Account and certain third-party clients.
SLC Management is the brand name for the institutional asset management business of Sun Life Financial Inc. (“Sun Life”) under which Sun Life Capital Management (U.S.) LLC in the United States, and Sun Life Capital Management (Canada) Inc. in Canada operate. Sun Life Capital Management (Canada) Inc. is a Canadian registered portfolio manager, investment fund manager, exempt market dealer and in Ontario, a commodity trading manager. Sun Life Capital Management (U.S.) LLC is registered with the U.S. Securities and Exchange Commission as an investment adviser and is also a Commodity Trading Advisor and Commodity Pool Operator registered with the Commodity Futures Trading Commission under the Commodity Exchange Act and Members of the National Futures Association.
Unless otherwise stated, all figures and estimates provided have been sourced internally and are as of December 31, 2024. Unless otherwise noted, all references to “$” are in U.S. dollars. Past performance is not indicative of future results.
Nothing herein constitutes an offer to sell or the solicitation of an offer to buy securities. The information in these materials is provided solely as reference material with respect to the Firm, its people and advisory services business, as an asset management company.
Market data and information included herein is based on various published and unpublished sources considered to be reliable but has not been independently verified and there is no guarantee of its accuracy or completeness.
This content may present materials or statements which reflect expectations or forecasts of future events. Such forward-looking statements are speculative in nature and may be subject to risks, uncertainties and assumptions and actual results which could differ significantly from the statements. As such, do not place undue reliance upon such forward-looking statements. All opinions and commentary are subject to change without notice and are provided in good faith without legal responsibility. Unless otherwise stated, all figures and estimates provided have been sourced internally and are current as at the date of the paper unless separately stated. All data is subject to change.
This information is not intended to provide specific financial, tax, investment, insurance, legal or accounting advice and should not be relied upon and does not constitute a specific offer to buy and/or sell securities, insurance or investment services. Investors should consult with their professional advisors before acting upon any information contained in this paper. An investor may not invest directly in an index.
No part of this material may, without SLC Management’s prior written consent, be (i) copied, photocopied or duplicated in any form, by any means, or (ii) distributed to any person that is not an employee, officer, director, or authorized agent of the recipient.
This material is intended for institutional investors only. It is not for retail use or distribution to individual investors. Nothing in this presentation should (i) be construed to cause any of the operations under SLC Management to be an investment advice fiduciary under the U.S. Employee Retirement Income Security Act of 1974, as amended, the U.S. Internal Revenue Code of 1986, as amended, or similar law, (ii) be considered individualized investment advice to plan assets based on the particular needs of a plan or (iii) serve as a primary basis for investment decisions with respect to plan assets.
Sun Life Capital Management (U.S.) LLC. also referred to as "SLC Fixed Income,” offers pooled funds, separately managed accounts and other investment advisory services with the support of the investment operations of SLC Management.
Data presented in this article have been calculated internally based on external market data sourced from Private Placement Monitor.
Investment-grade credit ratings of our private placements portfolio assets are based on a proprietary, internal credit rating methodology that was developed using both externally purchased and internally developed models. This methodology is reviewed regularly. More details can be shared upon request. There is no guarantee that the same rating(s) would be assigned to portfolio asset(s) if they were independently rated by a major credit ratings organization.
Investments involve risk, including loss of principal. Diversification does not guarantee against loss or ensure a profit. Nothing herein constitutes an offer to sell or the solicitation of an offer to buy securities. The information in these materials is provided solely as reference material with respect to the Firm, its people and advisory services business, as an asset management company.
SLC-20250203-4200916