
June 2026: Canadian Monthly Corporate Bond Watch
PM spotlight

Randall Malcolm, MSc, CFA
Senior Managing Director & Portfolio Manager, Public Fixed Income
Corporate credit spreads widened in June, driven primarily by exceptionally heavy supply. New issuance reached approximately $35 billion, the largest monthly total on record, supported by a record-breaking inaugural Canadian-dollar transaction from a technology issuer. A meaningful volume of long-end issuance also contributed to credit curve steepening after an extended period of flattening. Overall spread widening remained contained at approximately 2 basis points (bps), with markets retracing part of the move toward month end as fixed income flows improved.
Government of Canada yields moved slightly lower across the curve for the month, declining approximately 2–4 bps across the curve. Overall fixed income flows remained supportive, helped by strong demand for the asset class and rebalancing activity against a resilient equity market backdrop. In this context, the FTSE Canada Universe Bond Index returned 0.51% in June.
Canadian macroeconomic data were mixed. The Bank of Canada left its policy rate unchanged in June, as expected, and maintained a wait-and-see approach amid competing signals from inflation, labor markets, and trade developments. Uncertainty related to the U.S.-Mexico-Canada Agreement also continued to weigh on the outlook. In May, the headline Consumer Price Index rose to 3.2%, above expectations of 3.0% and the prior reading of 2.8%, while labor market data surprised to the upside, with net employment increasing by 88K jobs and the unemployment rate declining to 6.6%. Oil prices were another notable mover, declining materially over the month.
U.S./Canada relative value opportunities remain unchanged over June as swap pickup narrowed, which was offset by the U.S. corporate spreads widening by a greater margin than their Canadian counterparts.
| May 29 | June 30 | Change | |
|---|---|---|---|
| U.S./CA swap difference | 40 bps | 37 bps | -3 bps |
| U.S./CA OAS difference | -37 bps | -34 bps | 3 bps |
| U.S./CA relative value | 3 bps | 3 bps | 0 bps |
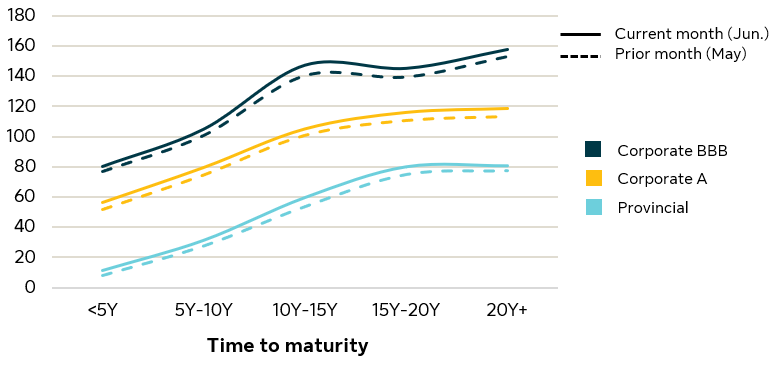
Credit spreads by quality and maturity (bps)1
During the month, corporate and provincial spreads widened slightly.
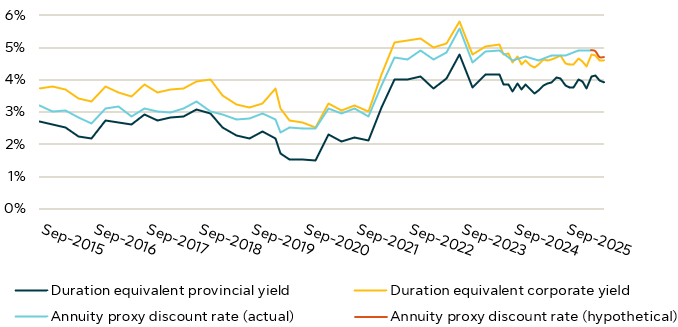
Annuity proxy and related duration equivalent yields (%)2
We expect the annuity proxy to decrease from the latest CIA guidance to 1.0% based on the current levels of credit spreads and the current shape of the risk free curve. The actual annuity proxy will also reflect changes based on annuity market competition, asset availability and changing longevity views, and will differ from this hypothetical estimate.
The content of this presentation is intended for institutional investors only. It is not for retail use or distribution to individual investors. All investments involve risk including the possible loss of capital. This presentation is for informational and educational purposes only. Past performance is not a guarantee of future results. This document may include statements which reflect expectations or forecasts of future events. Such forward-looking statements are speculative in nature and may be subject to risks, market events, uncertainties and assumptions and actual results which could differ significantly from the statements. As such, do not place undue reliance upon such forward-looking statements. All opinions and commentary are subject to change without notice and are provided in good faith without legal responsibility.
Unless otherwise stated, all figures and estimates provided have been sourced from Bloomberg and SLC Management internal credit research. The information provided on issuance is based on internal experience. Unless otherwise noted, all references to “$” are in CAD. Any reference to a specific asset does not constitute a recommendation to buy, sell or hold or directly invest in it. It should not be assumed that the recommendations made in the future will be profitable or will equal the results of the assets discussed in this document.
The information contained in this presentation is not intended to provide specific financial, tax, investment, insurance, legal or accounting advice and should not be relied upon and does not constitute a specific offer to buy and/or sell securities, insurance or investment services. Investors should consult with their professional advisors before acting upon any information contained in this presentation.
SLC Management is the brand name for the institutional asset management business of Sun Life Financial Inc. (“Sun Life”) under which Sun Life Capital Management (U.S.) LLC in the United States, and Sun Life Capital Management (Canada) Inc. in Canada operate, more info available at SLC Management.
1. Credit spreads by quality and maturity (graph)
Option adjusted spreads of the securities included in the FTSE Canada Universe Bond Index for different maturity buckets. Quality breakdown based on DBRS ratings. “FTSE®” is a trade mark of FTSE® International Limited and is used under license.
2. Annuity proxy and related duration equivalent yields: (graph)
The Annuity Proxy (Actual) references the appropriate spread to be added to the Government of Canada marketable bonds, average yield series, over 10 years (CANSIM V39062) as a proxy for the annuity purchase yield for a medium duration pension plan, as published in Canadian Institute of Actuaries (“CIA”)’s educational notes on “Assumptions for Hypothetical Wind-Up and Solvency Valuations” at various effective dates (“CIA’s educational notes”). Duration equivalent corporate and provincial yields are the duration neutral (relative to the liabilities) yields based on a blend of mid and long term FTSE Canada corporate and provincial indices. The Annuity Proxy (Hypothetical) is based on an internal SLC Management auto regression model that seeks to explain the historical “Average of the Three Most Competitive Hypothetical Quotes” (“hypothetical quotes”) as published in the CIA’s educational notes, using FTSE Canada provincial and corporate spreads, and changes in the shape of the Government of Canada risk free yield curve as explanatory variables. According to the CIA’s educational notes, these hypothetical quotes are given weight by the CIA in determining the annuity proxy guidance, in addition to data collected on actual annuity purchases and bona fide quotations. For greater certainty, the actual and bona fide quotations used by the CIA are not publically available and have not been considered in our determination of the Annuity Proxy (Hypothetical).
Hypothetical performance data does not represent the performance of actual client portfolios. Trading and other costs have not been deducted from the performance data (e.g. commissions and custodial fees). Hypothetical results may differ significantly from actual performance, as there may be variations in the percentage of each security held, the timing of security purchases and sales, and the availability and/or price of a particular security over time as the portfolio does not reflect actual market conditions. Forward-looking statements are speculative in nature and may be subject to risks, uncertainties and assumptions and actual results which could differ significantly from the statements. Do not place undue reliance upon such forward-looking statements.
Forward-looking statements are speculative in nature and may be subject to risks, uncertainties and assumptions and actual results which could differ significantly from the statements. Do not place undue reliance upon such forward-looking statements.
US/CA relative value (table)
US/CA swap difference is the weighted-average pickup that results from the cross currency swap based on the key rate durations of the Bloomberg Barclays US Long Corporate Index. US/CA OAS difference is the difference between the option adjusted spread of the Bloomberg Barclays US Long Corporate Index and the Bloomberg Barclays Canadian Long Corporate Index.
No part of this material may, without SLC Management’s prior written consent, be (i) copied, photocopied or duplicated in any form, by any means.
© SLC Management, 2026
SLC-20260720-5762737