Market
The IG private credit market is off to a good start in 2023, enhanced by a few deals that were postponed in 2022 due to market volatility. The following market statistics are for the private placement market, as provided by the Private Placement Monitor, and serve as a good proxy for the IG private credit market.Preliminary Q1 2023 issuance was $21 billion, behind Q1 2022’s issuance of $24.6 billion but ahead of the start of 2021’s issuance, in which the full year record was set. The main reason Q1 2023 lagged Q1 2022 was the record volume in March 2022 (which was the largest volume month of that year) as issuers rushed to market in advance of global central bank tightening. Notably, there were as many large deals (>$1 billion) in Q1 2023 as there were for all of 2022, driven by a combination of both corporate and structured transactions. Those larger deals drove volume as the number of transactions was lower than the prior two years, but the average transaction size was higher.
Financial issuance was down almost 50% year over year, driven by decreased issuance of both real estate investment trusts (REITs) and real estate, as well as by lower asset manager volume as higher interest rates continue to impact the sector. The financial sector accounted for almost 50% of Q1 2022 volume, but only 26% of volume in Q1 2023. Industrial, utility and transportation sector issuance all increased and partially offset the decline in financials. Cross-border issuance accounted for approximately 30% of volume, equal to the average of the prior two years, but below long-term historical levels of over 40%.
Investors are hunting for more diversification from the large amount of financial and REIT issuance over the past few years. Perhaps due to the economic uncertainty, we have not seen deals oversubscribed to the same extent as the prior two years. Despite the market volume, there is a bit of a mismatch as investors are focused on longer duration while issuers are seeking to borrow at shorter durations due to expectations that rates may come down in the next few years. Maturities of 10-years or less as a percentage of total issuance has increased materially since rates started to rise, from 44% in Q1 2021 to over 60% in Q1 2023.
While the failure of Silicon Valley Bank (SVB) sparked concerns over a broader banking crisis in the U.S. and brought the public bond market to a halt for a few weeks beginning mid-March, the IG private credit market didn’t miss a beat. This market is typically a safe haven during market turmoil for issuers who want certainty of execution. Private credit investors typically look past volatility and take a long-term view anchored in deep underwriting, structural and covenant protections and, oftentimes, security. Prior to SVB, we saw the market as a “Goldilocks” environment – in other words, well balanced with simple deals priced tightly and more complex deals with an appropriate premium. Since SVB there has been more price discovery and brokers report a wider dispersion of bids as investors wrestle with how to determine relative value based on the recent market uncertainty and movement in public bond spreads.
SLC Management
SLC Management’s U.S.-dollar fixed rate activity for Q1 2023 was selective, with 22 transactions amounting to just over $1 billion. The investment mix reflected a healthy mix of well-priced broadly marketed transactions and higher value club/proprietary transactions. SLC Management transactions averaged an 11-year weighted average life. In terms of quality, the mix between A and BBB for the quarter was 66% and 34%, respectively.
Outlook
Second quarters are typically active for IG private credit. The project finance, infrastructure and corporate markets are expected to remain busy, building on a solid first quarter. The private real estate market should be slower as higher interest rates and lower valuations make transactions difficult to execute. While we see increased competition from new investors attracted to opportunities in IG private credit, we also see potentially increased activity from any market uncertainty.
In focus: Why now is the right time to invest in IG private credit
With the current uncertainty surrounding the market, including higher inflation, rising interest rates and the recent regional banking crises, many investors are looking for investment opportunities that provide stable returns while minimizing risk. IG private credit has become an increasingly popular investment option for many institutional investors in recent years, with several characteristics that can be favorable against the current backdrop.
Enhanced yield:
IG private credit historically offers a yield premium over the public market even during times of volatility and economic stress. This yield premium reflects in part the lower liquidity of these investments compared to publicly traded fixed income securities.
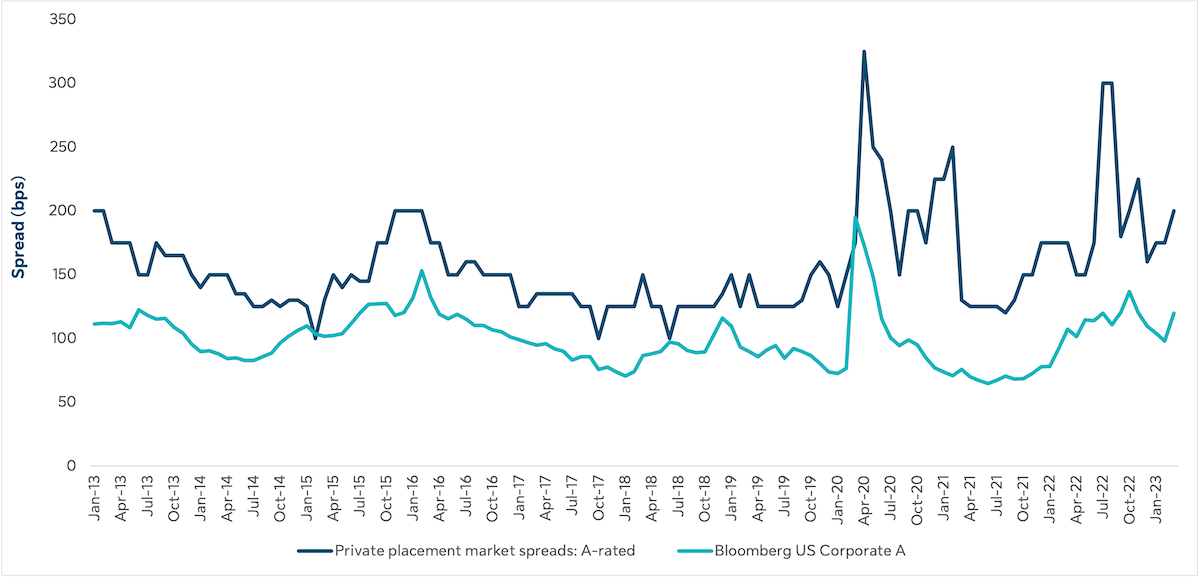
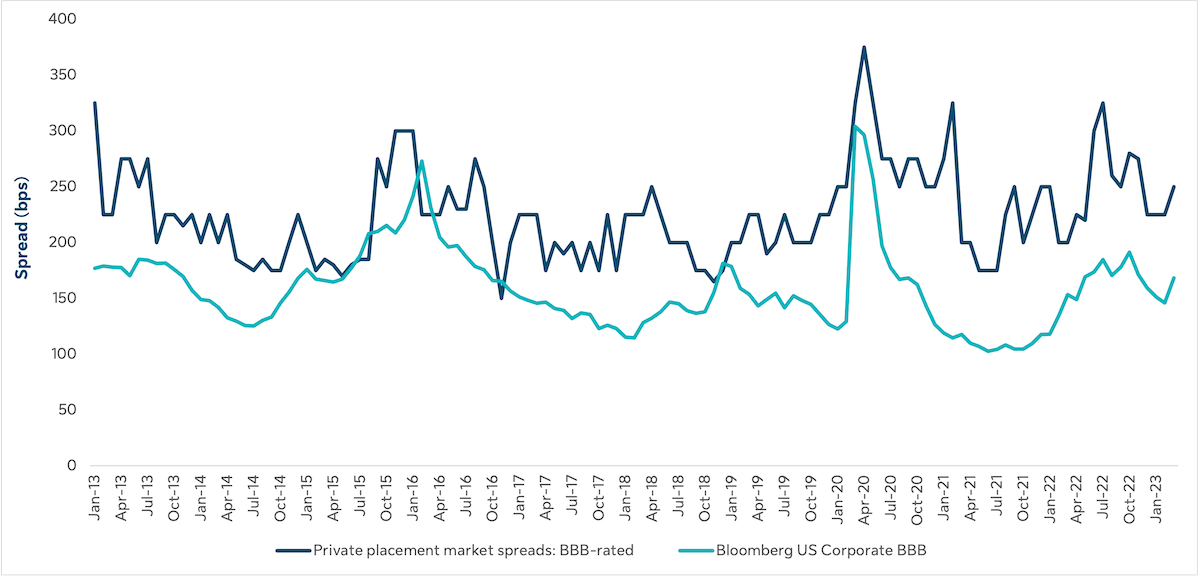
Historical evidence helps illustrate that during periods of market volatility, IG private credit as an asset class has been able to garner outsized market returns for a given unit of risk. For example, the COVID era allowed the IG private credit market to benefit from increased relative value without taking on additional risk, as indicated in the following exhibits comparing the spreads of U.S. private placements to their credit-quality equivalents in the public corporate bond market.
Private placement market spreads are higher than public market equivalents
Private placement A-rated spreads vs. A-rated public corporate credit spreads

Private placement BBB rated spreads vs. BBB rated public corporate credit spreads

Sources: Private Placement Monitor and Bloomberg, 2023. Private placement market spreads were sourced from the Private Placement Monitor using transactions with a 10-year average life. Bloomberg U.S. Corporate spreads calculated based on average OAS to Treasury for LCA1TRUU and LCB1TRUU indexes with an average life of 10.7 years and 11.3 years, respectively. Past performance is not necessarily indicative of future returns. The value of investments and the income derived from investments will fluctuate and can go down as well as up. A loss of principal may occur.
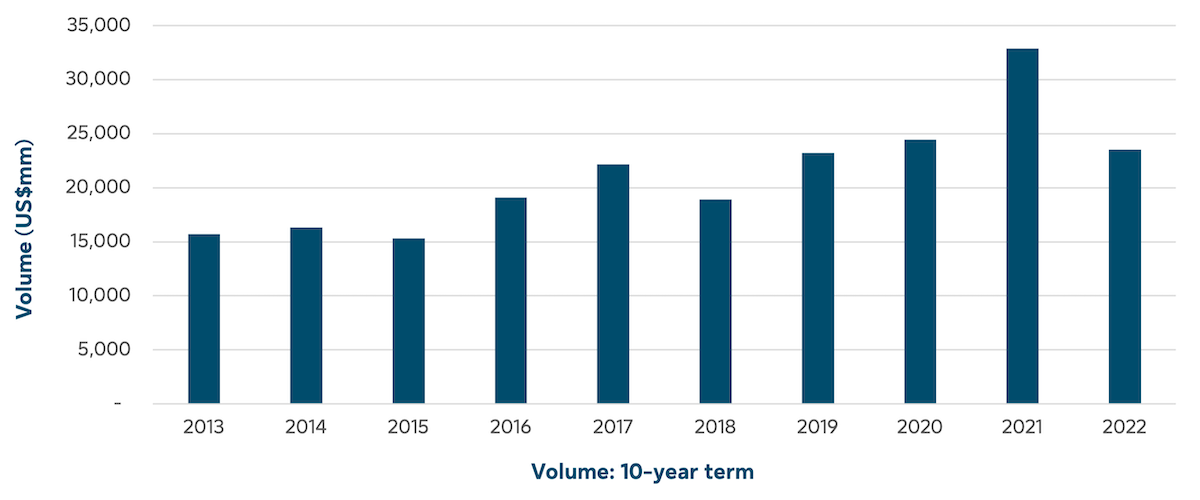
The following chart illustrates historical U.S. private placement market volumes with a 10-year term since 2013. The market has seen consistent growth over the decade, including during periods of high volatility and market turmoil.
Trading volumes in U.S. private placement market healthy amid changing market conditions
U.S. private placement market – volume (10-year term)

Source: Private Placement Monitor, as of December 2022.


