Crescent Capital Group Market Commentary Q4 2022
In the final quarter of 2022, all fixed income markets rallied retracing some of the losses sustained during the year, though most of them still finished the year in the red.
In the final quarter of 2022, all fixed income markets rallied retracing some of the losses sustained during the year, though most of them still finished the year in the red.
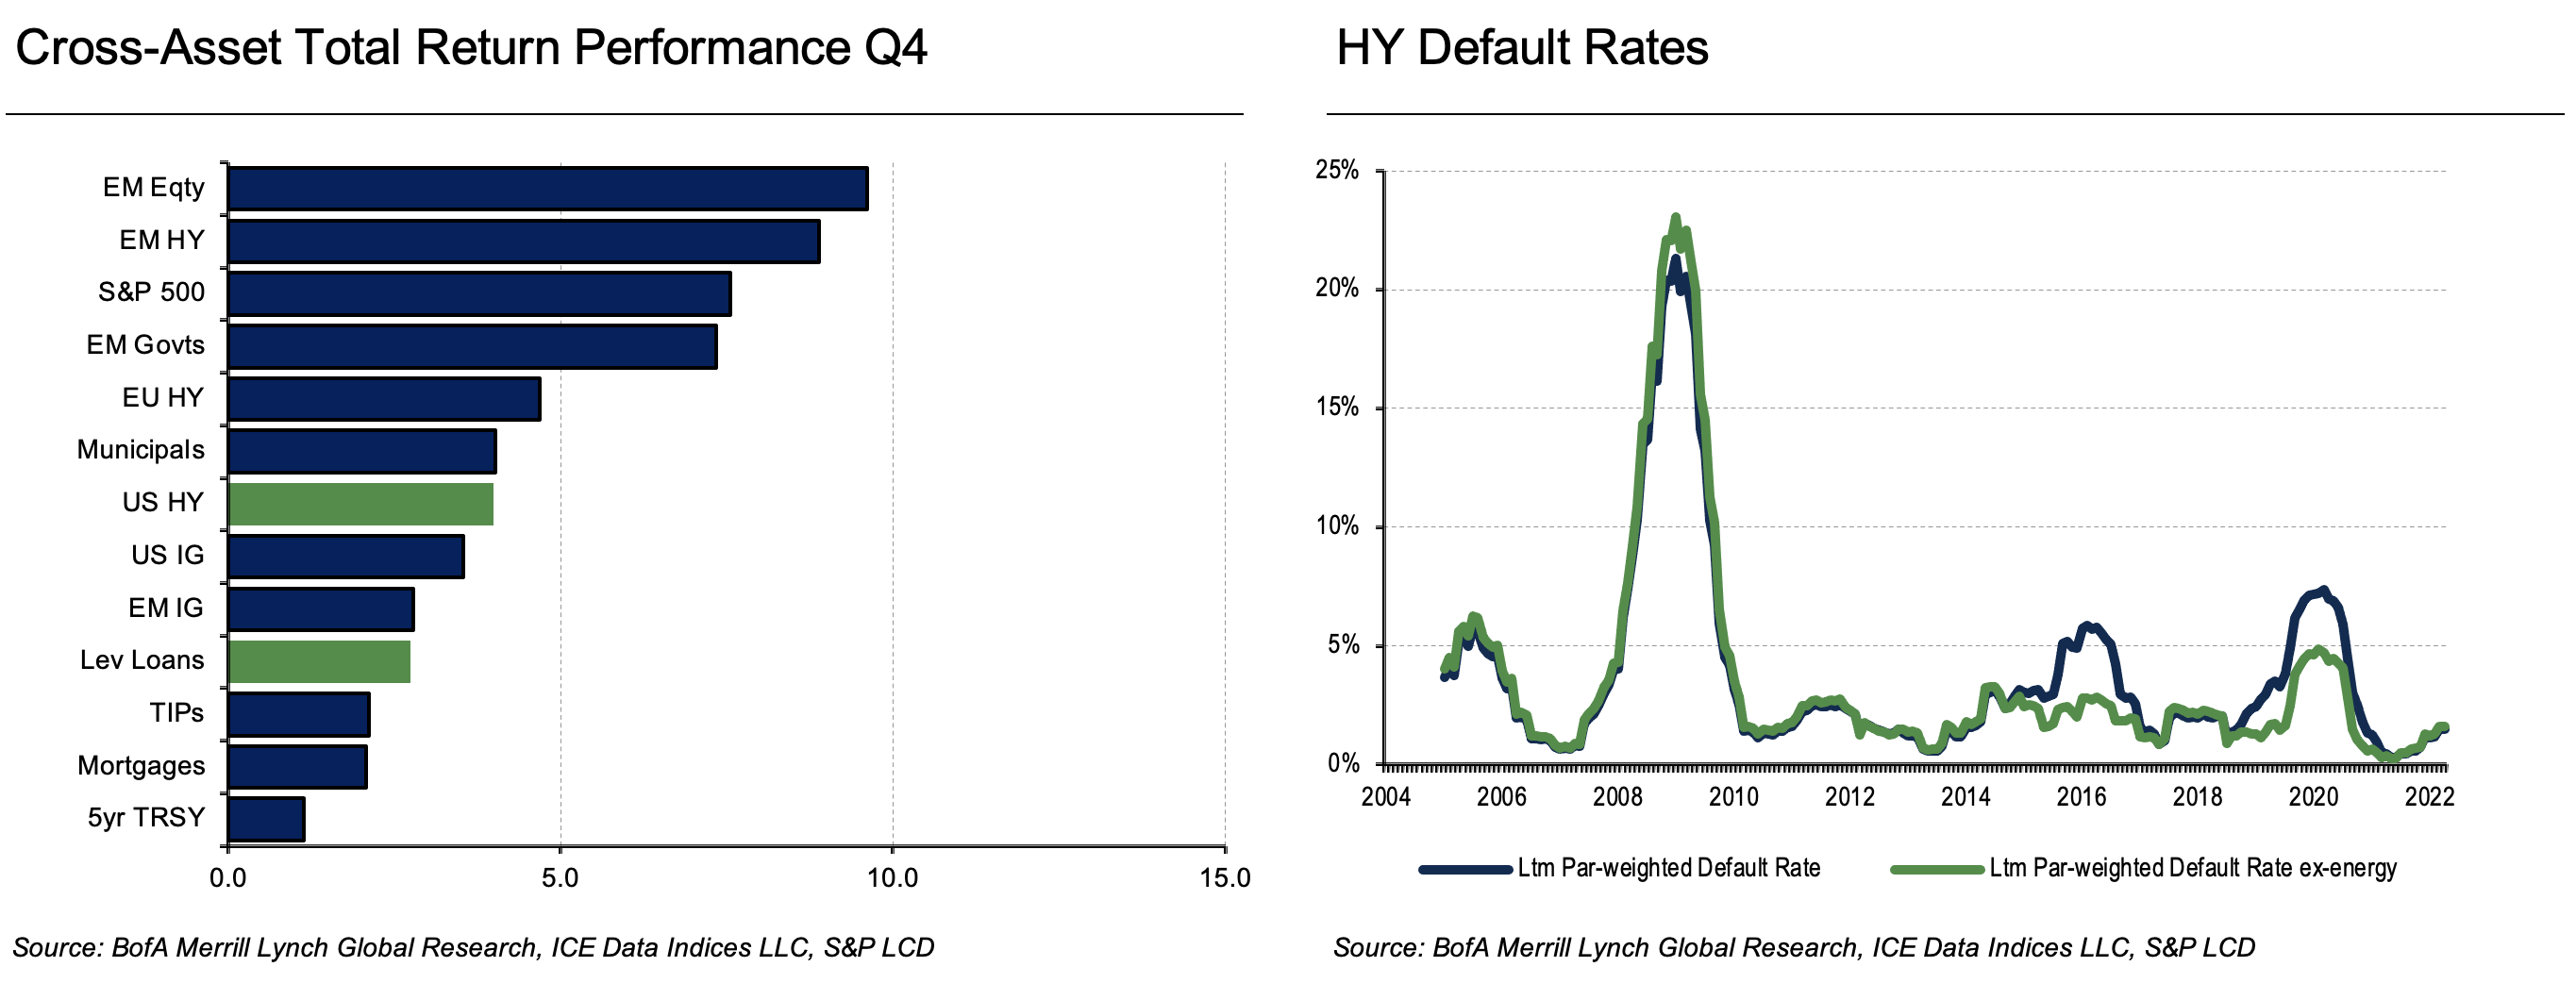
In the final quarter of 2022, all fixed income markets rallied retracing some of the losses sustained during the year, though most of them still finished the year in the red. More specifically in Q4, US high yield bonds generated +3.98% as measured by the ICE BAML US High Yield index and leverage loans returned +2.74% as measured by the Morningstar LSTA Leveraged Loan index. For the year, leveraged loans significantly outperformed all other major asset classes with a return of -0.60%, while US High Yield, European High Yield, US Investment Grade, TIPs, Mortgages, Emerging Market High Yield and Investment Grade and the S&P 500 Index all closed the year with double-digit negative returns.
During the quarter, the US Fed still continued to combat inflation and raised rates twice, 75 basis points in November and 50 basis points in December. Some investors believe the Fed may pause rate hikes after CPI prints came in below expectations consecutively in November and December and chair Powell was less hawkish than feared at the January FOMC meeting after delivering a 25 basis point rate hike.
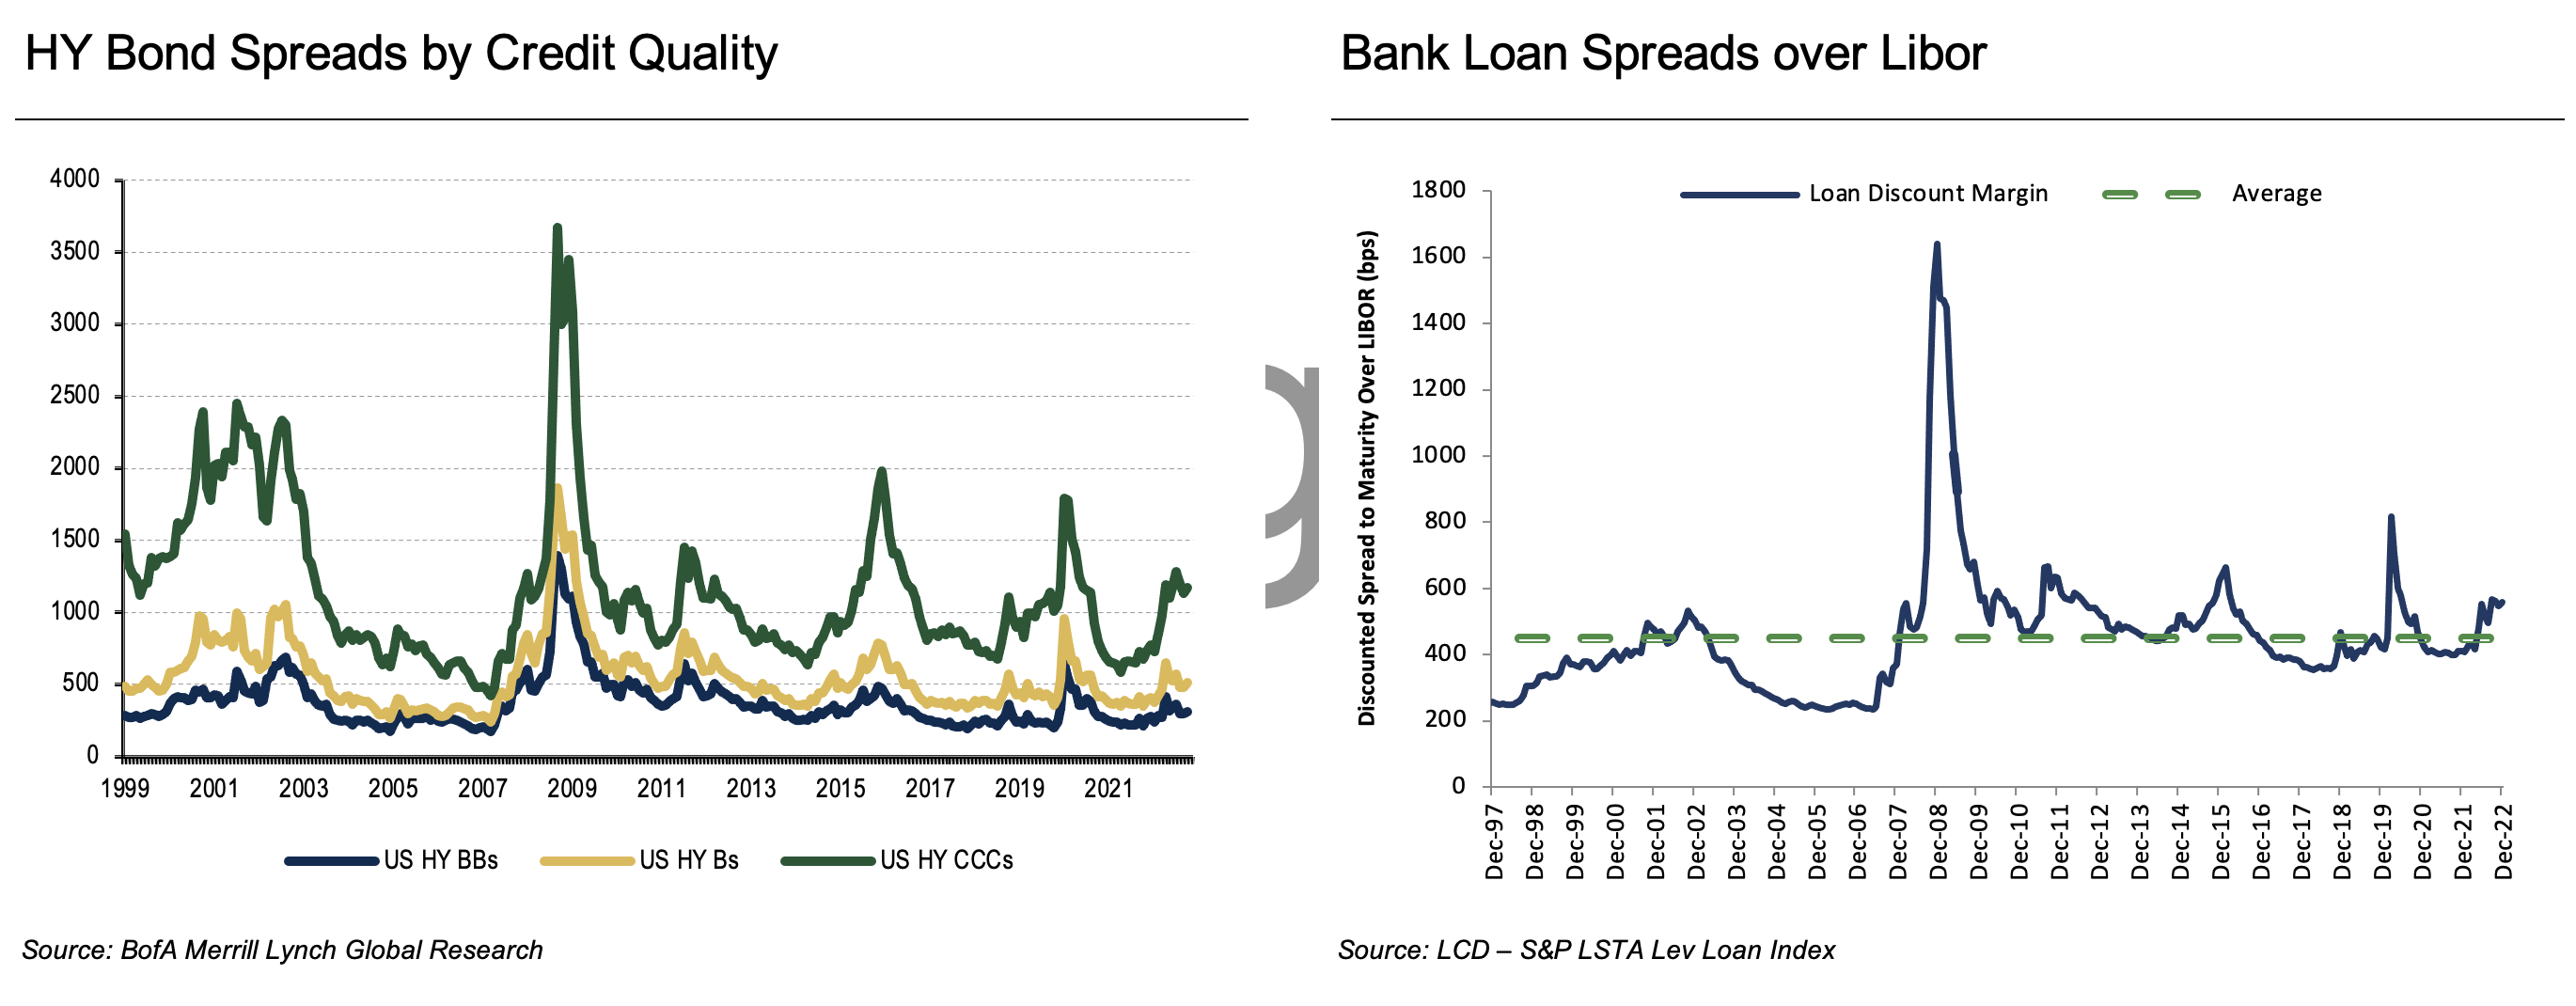
US Treasury yield moves were mixed; the 10-year ended the quarter at 3.87% (up 5 basis points since Q3 and up 274 basis points since the start of the year) and the 5-year ended at 4.00% (down 9 basis points since Q3 but up 236 basis points since the start of the year). Yields and spreads tightened in high yield bonds, ending Q4 at 8.99% and 491 basis points respectively, and in leveraged loans, yields tightened to 9.99%. WTI oil prices ended Q4 at $80.26/ barrel, mostly unchanged from last quarter and up 7% since the start of the year. The S&P 500 returned +7.55% in Q4 and -18.13% for the year.
All sectors were up in Q4 for the high yield market; the best performing sectors were Basic Industry, Banking and Capital Goods and the worst performing sectors were Media, Insurance and Technology & Electronics. For leveraged loans, the best performing sectors were Household Durables, Metals & Mining and Airlines and the worst performing sectors were Consumer Finance, Technology Hardware, Storage & Peripherals and Beverages. In terms of credit quality, BBs were the best performers in high yield bonds and leveraged loans. More specifically, BB bonds returned +4.36%, outperforming CCCs by 324 basis points and slightly outperforming Bs by 2 basis points. In leveraged loans, the dispersion was more pronounced with BBs returning +3.93% and outperforming B and CCC loans by 113 and 598 basis points, respectively.
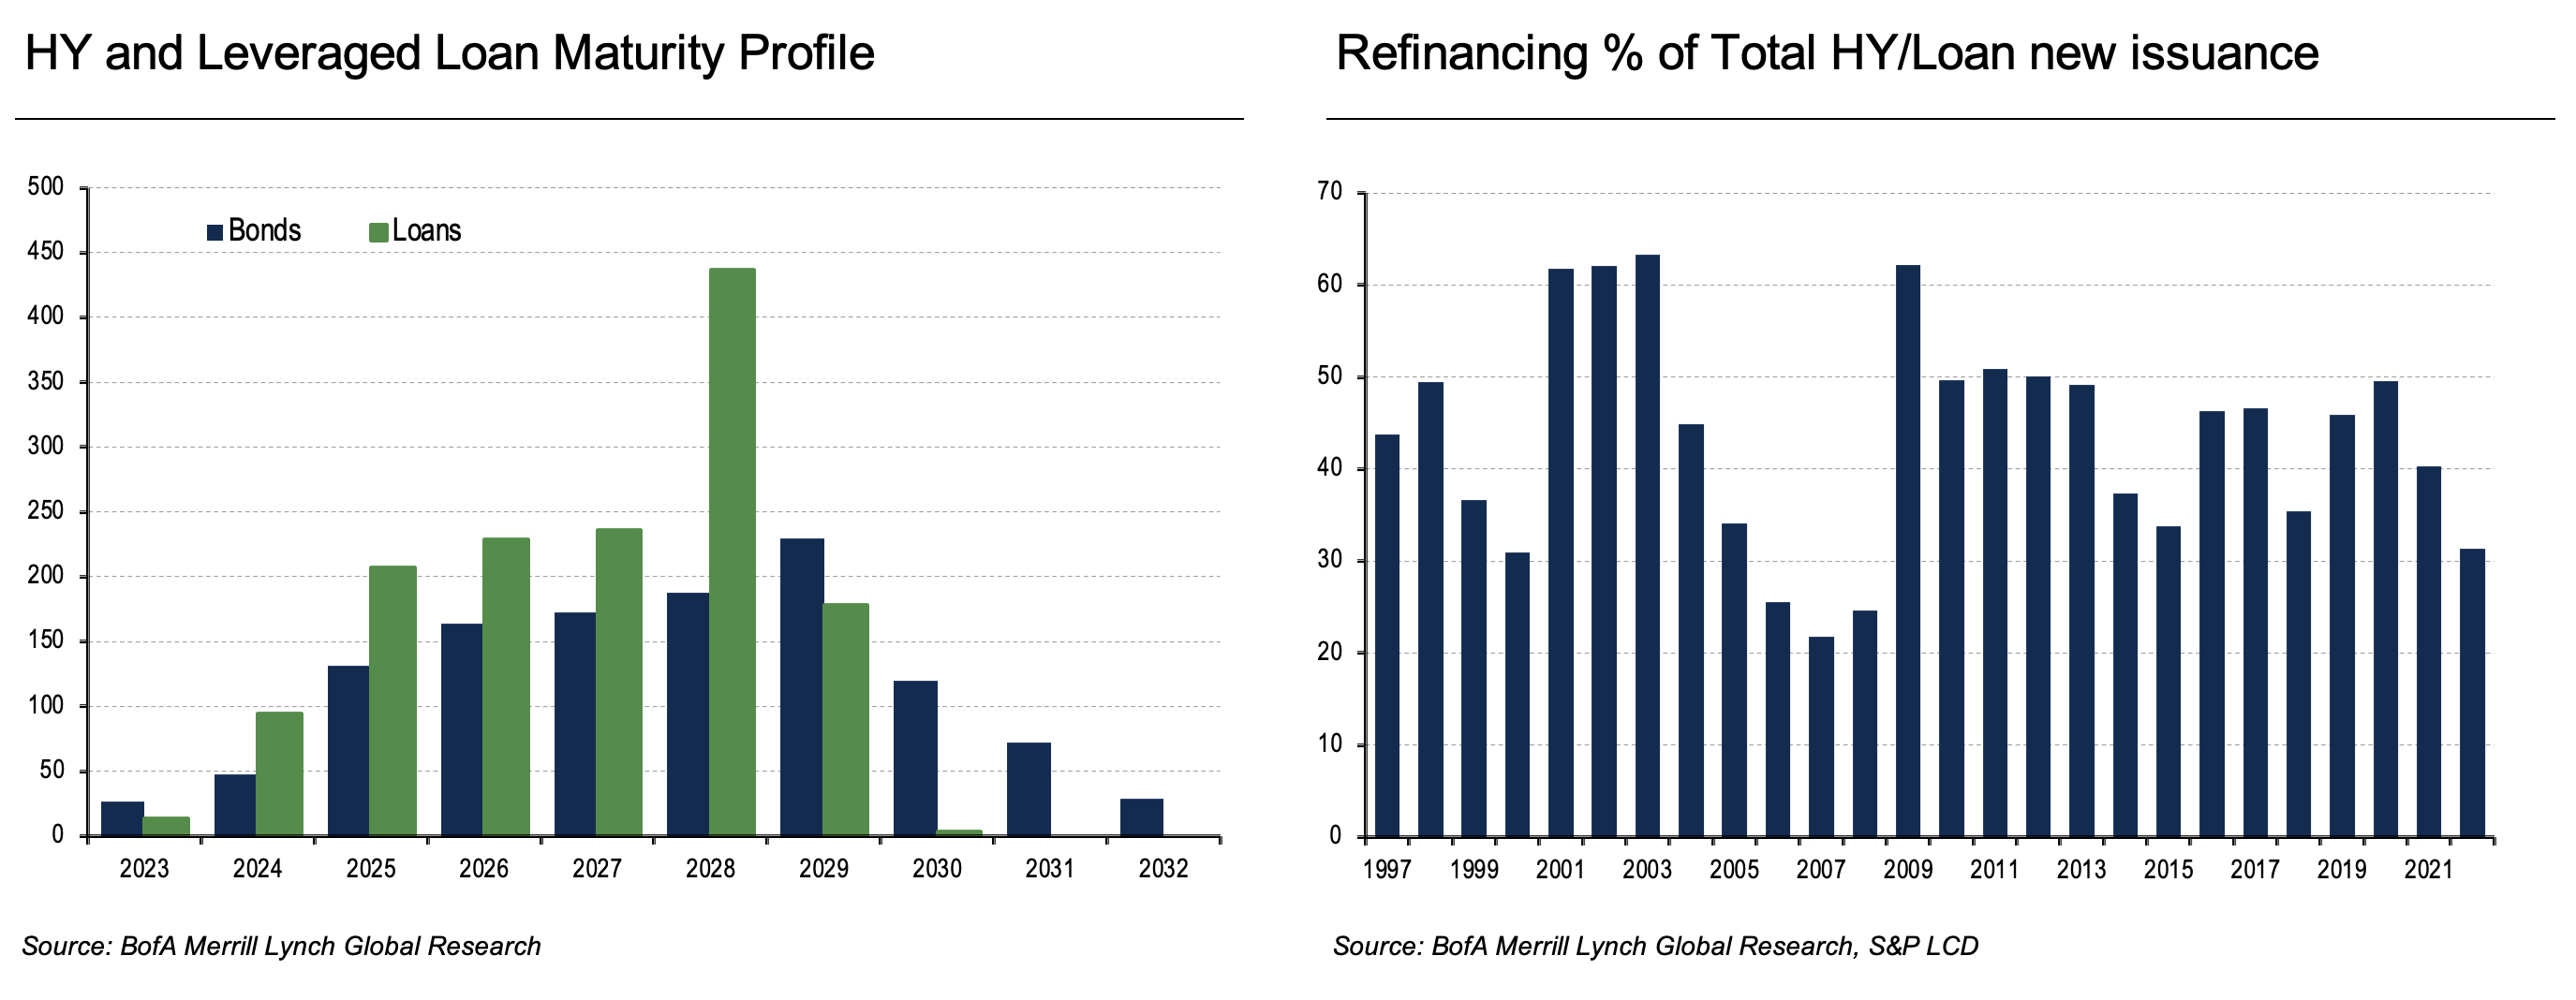
Quarterly fund flows were positive for the first time in 2022 in US high yield ($5.3 billion) but negative for leveraged loans ($12.7 billion). For the year, both asset classes ended 2022 with total outflows; US high yield stood at $48.9 billion and leveraged loans at $12.8 billion. New issue volumes were muted in Q4 amid higher yields with high yield bond issuance totaling only $16.5 billion gross. For the year high yield issuance totaled $106 billion (gross) /$56 billion (net), down 78% and 71% as compared to 2021, respectively. Similarly, loan issuance totaled $47.5 billion gross in Q4 and finished 2022 at $252 billion (gross) /$163 billion (net), which was down 70% and 60% as compared to 2021, respectively. The Moody's global LTM default rate for high yield bonds stood at 2.79% and for loans, it was 0.72% according to Morningstar LSTA at the end of Q4.
Investors faced nothing but headwinds in 2022, triggering major losses across asset classes, with double-digit concurrent declines in equity and fixed income markets not seen in a generation. However, going into 2023, the US high yield market is off to its strongest start since 2009, already up 4% and loans are up 2.7%, perhaps indicating a turnaround following outsized losses for fixed income markets in 2022. Interest rates have quickly stabilized as inflation gauges begin to decline, spurring fund inflows into fixed income. Credit fundamentals remain strong, although moderating, and we continue to expect most borrowers to exhibit revenue and cash flow growth in 2023, resulting in declining leverage ratios. However, at the same time, we believe interest coverage ratios have likely peaked as benchmark rates (and floating coupons) begin to increase from historically low levels. While elevated interest rates may pressure certain borrowers, many have ample liquidity and would benefit from private equity sponsor support, if needed. Credit defaults are likely to trend higher but are expected to remain below their historical averages in 2023.
Crescent Capital Group compliments and extends SLC Management’s fixed income pillar. With over 30 years in investment management, Crescent is known for a consistent track record in below investment grade capabilities.


This document expresses the views of the author as of the date indicated and such views are subject to change without notice. Neither the author nor Crescent Capital Group LP (“Crescent) has any duty or obligation to update the information contained herein. Further, Crescent makes no representation, and it should not be assumed, that past investment performance is an indication of future results.
Crescent makes this document available for educational purposes only and should not be used for any other purpose. The information contained herein does not constitute and should not be construed as an offering of advisory services or an offer to sell or solicitation to buy any securities or related financial instruments in any jurisdiction. Nor is the information intended to be nor should it be construed to be investment advice. Certain information contained herein concerning economic trends and performance may be based on or derived from information provided by independent third-party sources. The author and Crescent believe that the sources from which such information has been obtained are reliable; however, neither can guarantee the accuracy of such information nor have independently verified the accuracy or completeness of such information or the assumptions on which such information is based.
This document, including the information contained herein, may not be copied, reproduced, republished, or posted in whole or in part, in any form without the prior written consent of Crescent.
SLC-20230217-2743638