


Market update
Estimated U.S. investment grade private credit (IGPC) volume for the second half of 2020 was roughly $50 billion, compared to $32 billion in Q1 and Q2. While volume suffered in the first half of 2020 due to the pandemic-related disruption, the market recovered strongly in Q3 and Q4 amid an improving market backdrop and a backlog of new issue supply and strong investor demand. In total, USPP volume for 2020 was just over $100 billion, which more or less equalled the record volume of $100 billion in 2019 issuers.1
The ongoing uncertainty with respect to the pandemic contributed to historically wide spreads for IGPC in 2020, resulting in healthy yield premiums to similarly rated public bonds. Investors remain attracted to the incremental yield, structural protections and risk-adjusted returns offered by investment grade private credit. Insurance companies and retirement plans all saw an opportunity to add additional spread premium and diversification while retaining a high correlation to their financial liabilities.
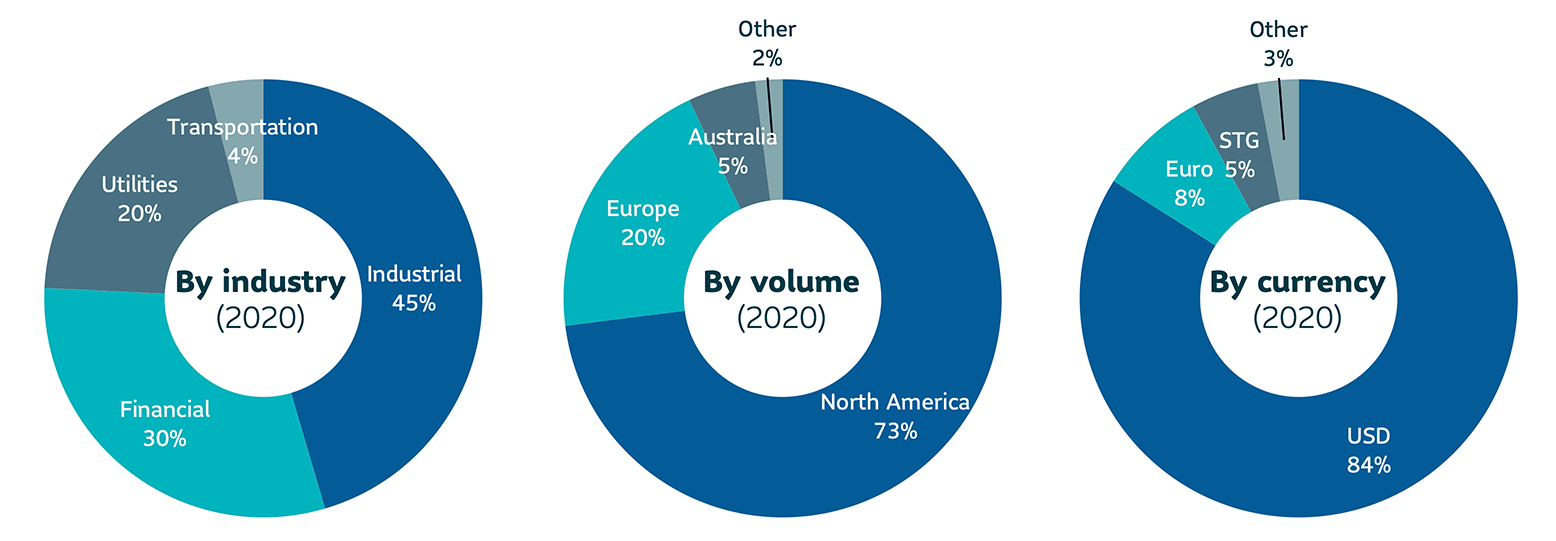
In terms of credit quality, the effects of the pandemic contributed to a bias in favour of higher-rated transactions. The proportion of NAIC-1 rated deals (A or higher) accounted for 48% of volume in 2020, compared to 40% in 2019. U.S. issuers and deals denominated in USD also accounted for a higher than usual share of volume – almost 85% – and reflected both the market disruption and the overall investor bias in favour of USD issuers.1
Pricing in the private market tends to lag the public markets, which can create opportunities to capture strong relative value. While public investment grade (IG) spreads tightened significantly in the second half of 2020 from the peak in March, private investment grade spreads remained attractive on a relative basis. Even well subscribed deals for high quality issuers priced wide of the traditional 20-25 basis points (bps) premium to publics, as investors demanded greater compensation for providing liquidity in a more uncertain market.1
1 Calculated internally based on external market data sourced from Private Placement Monitor
2020 U.S. private placement volume
2020 |
Avg WAL |
Avg rating |
Avg spread |
|---|---|---|---|
Private placement market |
12 yrs |
48%: A 52%: BBB |
250 |
Source: Private placement market data is calculated internally based on external market data sourced from Private Placement Monitor
The relative value over public benchmarks estimate is derived by comparing each loan’s spread at funding with a corresponding public corporate bond benchmark based on credit rating. Loans that are internally rated as “AA” are compared to the Bloomberg Barclays U.S. Corporate Aa Index, loans rated “A” are compared to the Bloomberg Barclays U.S. Corporate A Index, while loans rated “BBB” are compared to the Bloomberg Barclays U.S. Corporate Baa Index. For certain power and utility project loans, a best fit approach of a variety of Bloomberg Barclays’ indices was employed prior to September 30, 2016. After this date, these types of loans were compared to Bloomberg Barclays Utilities A Index and Bloomberg Barclays Utilities Baa Index, for “A” and “BBB” internally rated loans, respectively. Relative spread values obtained through the above methodologies were then aggregated and asset-weighted (by year) to obtain the overall spread value indicated in the paper.
Outlook for 2021
As we enter 2021 we expect deal volume to remain strong as issuers continue to value the confidentiality of the private market and the ability to diversify funding sources and achieve customized financing solutions. We believe the U.S. private placement (USPP) market is poised to have strong issuance in 2021, supported by continued low interest rates and an improving macro environment, both in the U.S. and in most developed markets. With public market spreads at pre-Covid levels, we expect spreads in the private market to tighten relative to publics and revert closer to historic levels. At SLC Management we will continue to focus on our strategy of pursuing sectors and structures that offer strong relative value and for investment opportunities which leverage our expertise and relationships.
In focus: Interview with Gary Greaves, Managing Director of Private Fixed Income at SLC Management
1. How would you characterize the USPP market in 2020? How did the pandemic impact volume/spreads?
Surprisingly, it appears that the pandemic did not impact volume or spreads significantly. All signs point to the 2020 market approaching 2019 levels, which was a record breaking year. I think this speaks to the stability of our market, which paused briefly in mid-March due to Covid-19, but rebounded strongly in April. Spreads to public bonds were widest in April and gradually tightened throughout the course of the year. Because we were active early during the Covid-related market volatility and throughout the year, we were able to capitalize on strong relative value in both the broadly distributed market, as well as in sectors where we have unique relationships and expertise like asset managers and transportation infrastructure.
2. Were there any notable trends worth mentioning? Types of deals, new investors
I’m excited about 2020 issuance for a few reasons. High quality issuers turned to the USPP market for funding in times of market volatility. Sports leagues, asset managers and professional service firms all issued in record amounts to ensure liquidity. And transaction sizes increased. There were 10 transactions of $1 billion or more, with the largest at $3 billion.3 This bodes well for market growth, as it demonstrates that the USPP market has the capacity to finance large deals, as well as smaller, more bespoke transactions. On the investor side, our market is anchored by stable U.S. insurance companies with a long-term, relationship orientation. New investors – led by asset managers, large pension plans and others attracted by strong credits and solid relative value – are entering our market. We believe this will help drive growth as our market will be able to fund larger and even more interesting deals.
3 Based on external market data sourced from Private Placement Monitor
3. How is pricing holding up?
Spreads have narrowed but relative value versus the public bond market is holding steady. This is partly due to minimum coupon requirements of some investors and the tendency of the private market to lag publics while both widening and tightening. Although pricing for more bespoke deals have also tightened, we continue to see solid relative value in the sectors and structures that we focus on.
4. What is your outlook for 2021?
2021 holds a lot of promise for the Private Placement market in the U.S. We continue to see attractive opportunities in the asset managers and structured investment grade debt sectors. Project Finance and Private Real Estate issuance should be more robust in 2021. As a major lender in those asset classes we are well positioned to capitalize on those opportunities. We expect interest rates to remain low and economic growth to resume as the economy recovers from the pandemic. Strong global liquidity and the attractiveness of our private asset class will continue to attract capital, tighten spreads and drive relative value in the broadly distributed market to more historical levels. These are all very positive signs for investors.
5. How does SLC Management compete in the marketplace? What is your message to clients?
SLC Management focuses on both deep sector expertise and strong origination and deal sourcing relationships. This enables us to source and underwrite deals that are unique or not as competitively bid as broader market deals. By increasing our deal flow we not only benefit from less competition, but it also improves our credit selection, as we have a larger universe of deals to invest in.
My message to clients is simple: investment grade private credit continues to prove itself as an attractive asset class. Year-in and year-out, throughout business cycles, and even pandemics. It’s a great diversifier in a portfolio, has solid relative value and benefits from covenants and structural protections that you don’t see regularly in the public markets.
The information in this paper is not intended to provide specific financial, tax, investment, insurance, legal or accounting advice and should not be relied upon and does not constitute a specific offer to buy and/or sell securities, insurance or investment services. Investors should consult with their professional advisors before acting upon any information contained in this paper.
SLC Management is the brand name for the institutional asset management business of Sun Life Financial Inc. (“Sun Life”) under which Sun Life Capital Management (U.S.) LLC in the United States, and Sun Life Capital Management (Canada) Inc. in Canada operate. Sun Life Capital Management (Canada) Inc. is a Canadian registered portfolio manager, investment fund manager, exempt market dealer and in Ontario, a commodity trading manager. Sun Life Capital Management (U.S.) LLC is registered with the U.S. Securities and Exchange Commission as an investment adviser and is also a Commodity Trading Advisor and Commodity Pool Operator registered with the Commodity Futures Trading Commission under the Commodity Exchange Act and Members of the National Futures Association. Registration as an investment adviser does not imply any level of skill or training. There is no assurance that the objective of any private placement strategy can be achieved. As with any strategy, the Advisor’s judgments about the relative value of securities selected for the portfolio can prove to be wrong.
There is no assurance that the objective of any private placement strategy can be achieved. As with any strategy, the Advisor’s judgments about the relative value of securities selected for the portfolio can prove to be wrong.
The relative value over public benchmarks estimate is derived by comparing each loan’s spread at funding with a corresponding public corporate bond benchmark based on credit rating. Loans that are internally rated as “AA” are compared to the Bloomberg Barclays U.S. Corporate Aa Index, loans rated “A” are compared to the Bloomberg Barclays U.S. Corporate A Index, while loans rated “BBB” are compared to the Bloomberg Barclays U.S. Corporate Baa Index. For certain power and utility project loans, a best fit approach of a variety of Bloomberg Barclays’ indices was employed prior to September 30, 2016. After this date, these types of loans were compared to Bloomberg Barclays Utilities A Index and Bloomberg Barclays Utilities Baa Index, for “A” and “BBB” internally rated loans, respectively. Relative spread values obtained through the above methodologies were then aggregated and asset-weighted (by year) to obtain the overall spread value indicated in the paper.
Unless otherwise stated, all figures and estimates provided have been sourced internally and are as of December 31, 2020. Unless otherwise noted, all references to “$” are in U.S. dollars.
This document may present materials or statements which reflect expectations or forecasts of future events. Such forward-looking statements are speculative in nature and may be subject to risks, uncertainties and assumptions and actual results which could differ significantly from the statements. As such, do not place undue reliance upon such forward-looking statements. All opinions and commentary are subject to change without notice and are provided in good faith without legal responsibility. Unless otherwise stated, all figures and estimates provided have been sourced internally and are current as at the date of the paper unless separately stated. All data is subject to change.
No part of this material may, without SLC Management’s prior written consent, be (i) copied, photocopied or duplicated in any form, by any means, or (ii) distributed to any person that is not an employee, officer, director, or authorized agent of the recipient.
© 2021, SLC Management
SLC-20221103-2572234