


Market
Estimated U.S. investment grade private credit (IGPC) volume for the first half of 2021 was $41.2 billion, based on almost 200 reported transactions. This represented about a 30% increase from 1H20 volume, which was significantly impacted by the coronavirus pandemic.1
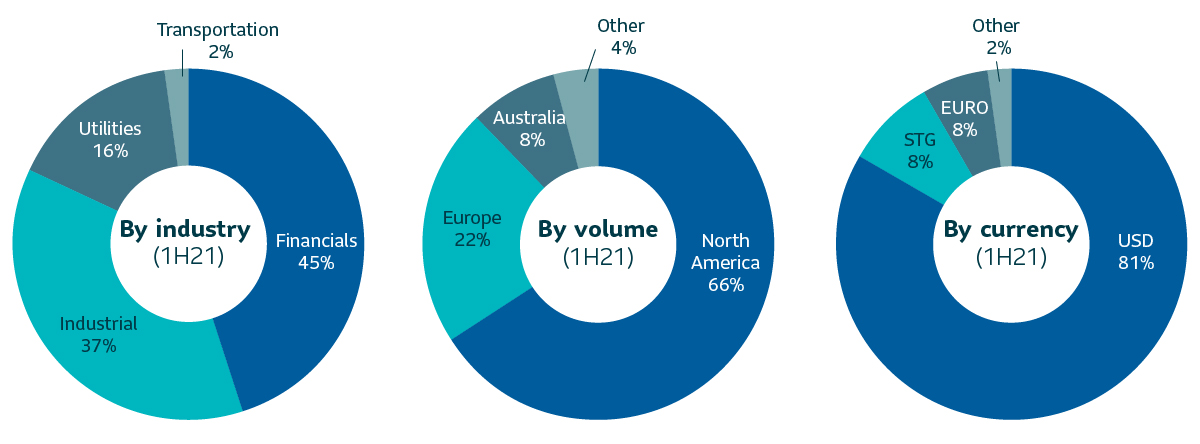
Volume for the year-to-date has been driven predominately by financial issuers, which includes asset managers, investment funds, finance companies and REITs. The financial sector accounted for almost 50% of the reported volume through June 30, as issuers such as alternative asset managers, business development companies (BDCs) and private investment funds continued to tap the private credit markets to support growth initiatives. North American issuers accounted for almost 66% of volume in 1H21 (vs 68% in 1H20), while issuers of USD accounted for 80% of the total, compared to 87% in 1H20, as non-US issuers found a more receptive market in the U.S. to issue in Euros and GBP.2
The bias in favor of A rated issues (NAIC-1) has moderated through 1H21, as issues rated A or better accounted for 34% of the volume, compared to almost 50% in 1H20. Historically, the private market’s long-term average has been around 60-65% in favor of issues rated BBB (NAIC-2). Average deal size for 1H21 was around $212 million, which is consistent with historic averages, and there were 8 transactions of >$1 billion.
With respect to pricing, private credit spreads – along with the public market –continued to tighten from the peaks experienced in March and April of 2020. In many cases, spreads are inside pre-Covid levels, but yields have been supported by higher Treasury rates compared to pre-Covid levels.
| 1H20 | 1H21 | yoy %chg | |
|---|---|---|---|
| Total volume | 21,728 |
41,212 |
30% |
| NAIC 1 | 15,763 |
13,991 |
-11% |
| NAIC 2 | 15,915 |
26,792 |
68% |
| USD volume | 27,608 |
33,372 |
21% |
Non-USD volume |
4,119 |
7,841 |
90% |
| North America | 21,596 |
27,126 |
26% |
| Outside North America | 10,132 |
14,086 |
39% |
| Cross border | 10,984 |
14,458 |
32% |
Delayed takedown |
5,138 |
6,112 |
19% |
| Number of issuers | 132 |
194 |
62% |
Outlook
Looking forward to Q3 and the balance of the year, we expect the ongoing strengthening in U.S. economic activity will support strong issuance in the private market. While private spreads have tightened relative to publics, we at SLC Management continue to see value in more bespoke opportunities and in sectors such as Financials where we believe we have a knowledge and sourcing advantage.
1H 2021 |
Weighted avg life |
Avg rating |
Avg spread3 |
|---|---|---|---|
Private placement market 4 |
12 yrs |
34%: A 66% BBB |
177 |
3 USD fixed rate deals
4 Private placement market data is calculated internally based on external market data sourced from Private Placement Monitor
The relative value over public benchmarks estimate is derived by comparing each loan’s spread at funding with a corresponding public corporate bond benchmark based on credit rating. Loans that are internally rated as “AA” are compared to the Bloomberg Barclays U.S. Corporate Aa Index, loans rated “A” are compared to the Bloomberg Barclays U.S. Corporate A Index, while loans rated “BBB” are compared to the Bloomberg Barclays U.S. Corporate Baa Index. For certain power and utility project loans, a best fit approach of a variety of Bloomberg Barclays’ indices was employed prior to September 30, 2016. After this date, these types of loans were compared to Bloomberg Barclays Utilities A Index and Bloomberg Barclays Utilities Baa Index, for “A” and “BBB” internally rated loans, respectively. Relative spread values obtained through the above methodologies were then aggregated and asset-weighted (by year) to obtain the overall spread value indicated in the paper.
In Focus: Find your edge: Understanding the yield advantage in investment grade private credit
In the current low yield environment, where 10-year Treasuries only yield 1.2% and investment grade credit only yields a slightly higher 1.8%, investment grade private credit (IGPC) continues to be one of the last bastions of the market offering relatively attractive yields. At SLC Management, our IGPC strategies have out-yield their public market counterpart by 107 bps over the last nine years.
So, where does the additional yield come from. Is it an illiquidity discount? Are private market investors simply reaching down in quality without regard for what might happen when the market turns? The truth is that while there is some illiquidity premium in this market, it is a very small component of excess yields. And as shown below, we don’t consider IGPC to be a step down in quality, in fact it’s the opposite. Instead, excess yields are usually the result of lenders providing bespoke credit solutions for borrowers with unique cash-flow profiles or providing financing for borrowers who wish to remain private. Both of which provide a premium for the lender.
Myth 1: There is a yield advantage because IGPC is illiquid and lower quality than public markets
As demonstrated in our 2021 Q1 IGPC quarterly update, the market is actually reasonably liquid, with secondary deals exchanging hands frequently. This means that while there is an illiquidity discount, the number is rather small. We estimate the typical illiquidity premium to be about 25bps (the additional yield on the most broadly syndicated IGPC loans). This explains only a small portion of the excess yield achievable in the asset class.
Contrary to the concern that managers are reaching down in quality, SLC Management’s IGPC portfolios are mostly BBB/A rated. In private market deals, IGPC lenders have the additional advantage of having a degree of influence over the covenants and typically have strong collateral backing the deals. The combination of these factors helps boost the recovery rate in a default scenario. Our IGPC strategies have consistently demonstrated lower defaults and higher recovery rates than the corresponding public indices.5 This high level of security is one of the reasons why insurance investors have favored IGPC for so long.
Myth 2: There is a yield advantage because of the esoteric nature of IGPC deals
While private credit lenders thrive on providing tailored solutions for unique financing situations, the projects they finance are by no means outside the norm. Many of the borrowers are household names with the preference for private financing because their projects have specific cash flow profiles that make financing with a public market offering a poorer fit.
Below is a case study involving the long construction cycle of a modern high-tech distribution center. This project provided SLC Management the opportunity to create a unique financing solution for a developer without the typical risk associated with construction loans.
Case study 1: Warehouse for online retailer
SLC Management provided both the construction and permanent financing of a large online retailer’s new warehouse. While the borrower is the developer, the structure of the deal means that we are gaining credit exposure to an investment grade rated leading online retailer.
The developer repays the loan through rent received from the large online retailer, which is locked into a long-term lease. These cashflows are extremely secure, not just because of the long-term lease, but also the large amount of capital expenditure the online retailer would be investing into the space, locking in its commitment. Construction risk is assumed by the retailer and the entire financing is further secured by the property itself. The leases are triple net, where the retailer pays for all property taxes, insurance, and maintenance. To further secure payment of cash flows, the deal structure requires lease payments to be made directly to a trustee who prioritizes payment to SLC Management ahead of the borrower. In essence, while this is a loan to the developer on paper, SLC Management is just taking on credit risk of the large online retailer.
SLC Management also provides financing to companies who choose to remain private for other reasons. A prime example of this would be professional sports leagues, which do not wish to disclose their finances. Another example are the Big Four accounting firms, which cannot access public markets because they are private partnerships, and due to the potential conflicts of interest. Private lenders such as SLC Management help finance these well know entities and earns an extra yield for doing so.
Case Study 2: A professional sports league
Similar to the long-term warehouse leases, SLC Management’s loans to the sports league are secured by long-term contracts, in this case long term media contracts. The revenues from the media contracts are paid directly into a trust, not to the league, and cashflows from the trust pay the principal and interest on the loans before paying the teams. This model is common for all four major sports leagues in the U.S.
Overall, the private market has a very sophisticated issuer base where deals are not broadly syndicated via capital markets desks. Instead, they are narrowly marketed by intermediaries who value the long-term relationship. Ultimately, lenders that are focused on understanding these unique financing situations are rewarded for helping to provide tailored financing.
1 Calculated internally based on external market data sourced from Private Placement Monitor
2 Private Placement Monitor Database
3 USD fixed rate deals
4 Private placement market data is calculated internally based on external market data sourced from Private Placement Monitor
5 Past performance is not indicative of future results.
Data presented in this article has been calculated internally based on external market data sourced from Private Placement Monitor.
The information in this paper is not intended to provide specific financial, tax, investment, insurance, legal or accounting advice and should not be relied upon and does not constitute a specific offer to buy and/or sell securities, insurance or investment services. Investors should consult with their professional advisors before acting upon any information contained in this paper.
SLC Management is the brand name for the institutional asset management business of Sun Life Financial Inc. (“Sun Life”) under which Sun Life Capital Management (U.S.) LLC in the United States, and Sun Life Capital Management (Canada) Inc. in Canada operate. Sun Life Capital Management (Canada) Inc. is a Canadian registered portfolio manager, investment fund manager, exempt market dealer and in Ontario, a commodity trading manager. Sun Life Capital Management (U.S.) LLC is registered with the U.S. Securities and Exchange Commission as an investment adviser and is also a Commodity Trading Advisor and Commodity Pool Operator registered with the Commodity Futures Trading Commission under the Commodity Exchange Act and Members of the National Futures Association. Registration as an investment adviser does not imply any level of skill or training. There is no assurance that the objective of any private placement strategy can be achieved. As with any strategy, the Advisor’s judgments about the relative value of securities selected for the portfolio can prove to be wrong.
The relative value over public benchmarks estimate is derived by comparing each loan’s spread at funding with a corresponding public corporate bond benchmark based on credit rating. Loans that are internally rated as “AA” are compared to the Bloomberg Barclays U.S. Corporate Aa Index, loans rated “A” are compared to the Bloomberg Barclays U.S. Corporate A Index, while loans rated “BBB” are compared to the Bloomberg Barclays U.S. Corporate Baa Index. For certain power and utility project loans, a best fit approach of a variety of Bloomberg Barclays’ indices was employed prior to September 30, 2016. After this date, these types of loans were compared to Bloomberg Barclays Utilities A Index and Bloomberg Barclays Utilities Baa Index, for “A” and “BBB” internally rated loans, respectively. Relative spread values obtained through the above methodologies were then aggregated and asset-weighted (by year) to obtain the overall spread value indicated in the paper.
Unless otherwise stated, all figures and estimates provided have been sourced internally and are as of December 31, 2020. Unless otherwise noted, all references to “$” are in U.S. dollars.
This document may present materials or statements which reflect expectations or forecasts of future events. Such forward-looking statements are speculative in nature and may be subject to risks, uncertainties and assumptions and actual results which could differ significantly from the statements. As such, do not place undue reliance upon such forward-looking statements. All opinions and commentary are subject to change without notice and are provided in good faith without legal responsibility. Unless otherwise stated, all figures and estimates provided have been sourced internally and are current as at the date of the paper unless separately stated. All data is subject to change.
No part of this material may, without SLC Management’s prior written consent, be (i) copied, photocopied or duplicated in any form, by any means, or (ii) distributed to any person that is not an employee, officer, director, or authorized agent of the recipient.
© 2021, SLC Management
SLC-20221103-2572234