

Explore institutional insights


Funded status falls due to negative investment performance
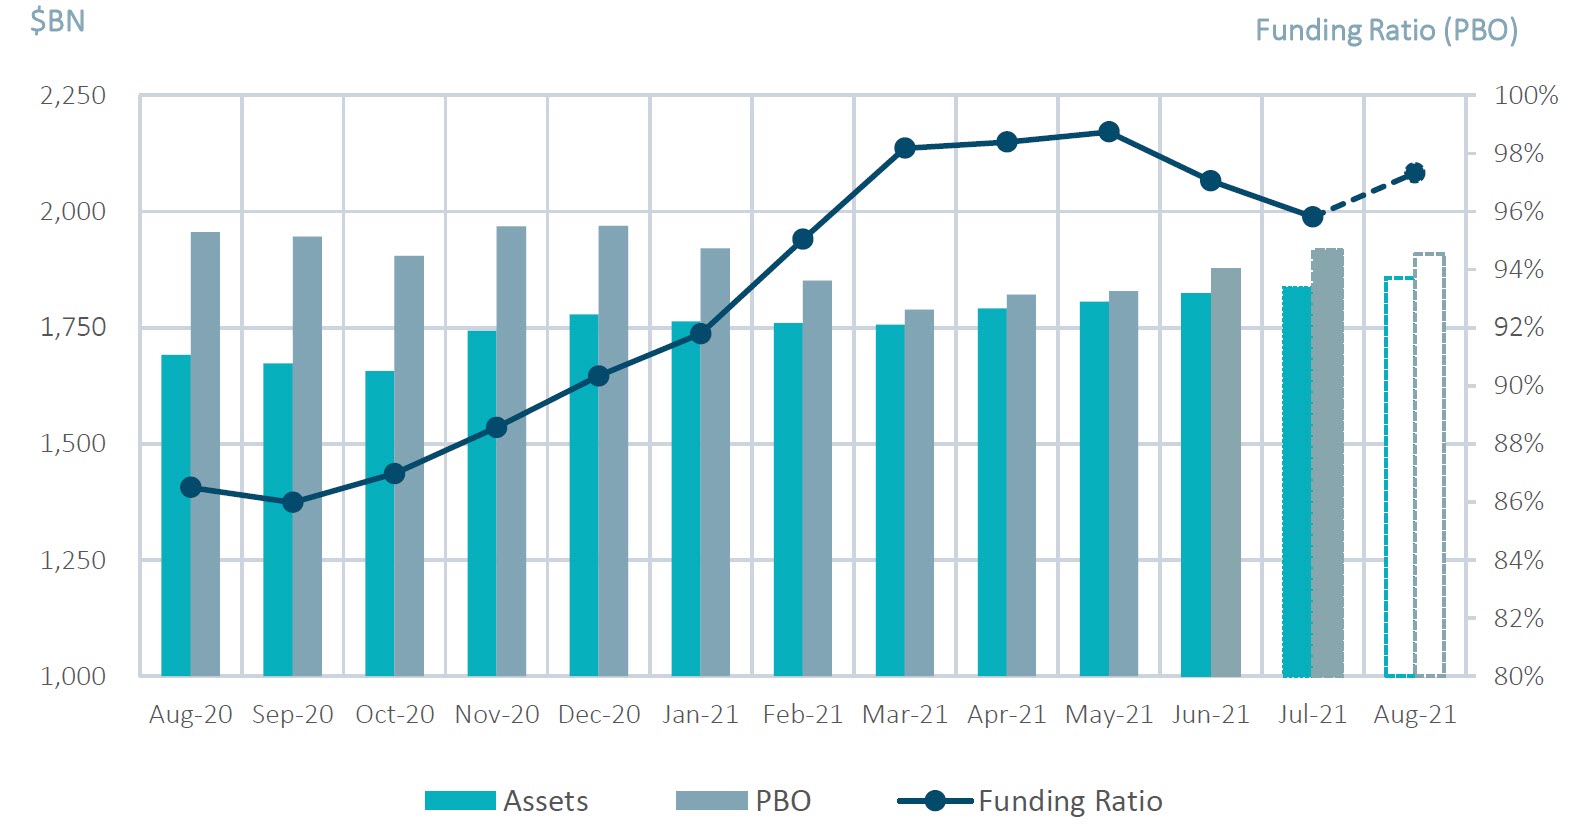
August Market Summary
- Average funded status increased by 1.5% to 97.3%: Assets returned 1.1%, while an increase in discount rates decreased liabilities by 0.4%¹.
- U.S. equity markets posted their seventh consecutive positive month: The S&P 500 rallied another 2.9% in August and is now up 20.4% since the start of the calendar year.
- The yield on the Bloomberg Barclays Long Credit Index increased 4 basis points (bps): Long credit spreads remained unchanged while the underlying Treasury basis increased 4 bps¹.
| Market Watch | Dec 2019 | Dec 2020 | Jul 2021 | Aug 2021 |
|---|---|---|---|---|
| Funded status | 90% | 90% | 96% | 97% |
| CITI discount rate2 | 3.01% | 2.23% | 2.44% | 2.50% |
| Long Credit yield2 | 3.63% | 2.78% | 2.94% | 2.98% |
| U.S. 30Y TSY yield | 2.39% | 1.64% | 1.89% | 1.93% |
| S&P 500 | 3,231 | 3,756 | 4,395 | 4,523 |
Spotlight: Taking advantage of intermediate duration private credit to improve yield and out earn inflation
- The economy has rebounded very quickly from the depth of the Covid-19 induced recession thanks to the vaccine-backed reopening and an unprecedented government stimulus. In fact, the Covid-19 recession of 2020 lasted just two months, the shortest in U.S. history.
- Nevertheless, rates have remained low, and with the 10-year currently yielding 1.3%, investors have been looking elsewhere for additional yield.
- The need for yield is especially glaring in the front end of the yield curve, where intermediate corporates only yield 1.3%, well below the current rate of core inflation of 4.3%.
- In this environment, we have seen a lot of interest in investment grade private credit (IGPC) as a source of diversified alpha. While many investors are familiar with the benefits of this asset class in the long duration space, the opportunity in intermediate IGPC can be as, or in some cases more, attractive.
- The spread curve in IGPC is relatively flat, meaning that the yield advantage of IGPC over comparable publics can often be wider on the front end of the yield curve.
- A key driver of this phenomenon is that traditionally, the most important buyers in the IGPC market have been life insurers, and more recently, DB pension plans, who both prefer longer-dated deals to match their liabilities, resulting in lower demand / wider spreads for deals on the front end. This demand is structural, meaning that the yield advantage will likely persist until a larger buyer base is established.
- An allocation to intermediate IGPC can be especially attractive for plans with significant fixed income allocation who want to improve curve matching while maintaining yield and diversifying credit risk or for mature plans with shorter duration profiles who have significant exposure in the two to seven year part of the curve.
- SLC Management’s experience with our intermediate IGPC portfolio (duration approx. 4.5 years) has been a spread differential of 179 bps since the beginning of 2019 versus a comparably rated public bond portfolio.
Milliman Pension Funding Index (August Estimate)
¹Funded Status for the month of August is estimated and subject to change as final numbers are released. Data from reference Bloomberg Barclays Indices.
²The CITI discount rate corresponds to the FTSE short pension liability index. The Long Credit yield corresponds to the BBgBarc Long Credit Index.
Investment grade credit ratings of our private placement’s portfolio are based on a proprietary, internal credit rating methodology that was developed using both externally purchased and internally developed models. This methodology is reviewed regularly. More details can be shared upon request. Although most U.S. dollar private placement investments have an external rating, for unrated deals, there is no guarantee that the same rating(s) would be assigned to portfolio asset(s) if they were independently rated by a major credit ratings organization.
The relative value over public benchmarks estimate is derived by comparing each loan’s spread at funding with a corresponding public corporate bond benchmark based on credit rating. Loans that are internally rated as “AA” are compared to the Bloomberg Barclays U.S. Corporate Aa Index, loans rated “A” are compared to the Bloomberg Barclays U.S. Corporate A Index, while loans rated “BBB” are compared to the Bloomberg Barclays U.S. Corporate Baa Index. For certain power and utility project loans, a best fit approach of a variety of Bloomberg Barclays’ indices was employed prior to September 30, 2016. After this date, these types of loans were compared to Bloomberg Barclays Utilities A Index and Bloomberg Barclays Utilities Baa Index, for “A” and “BBB” internally rated loans, respectively. Relative spread values obtained through the above methodologies were then aggregated and asset-weighted (by year) to obtain the overall spread value indicated in the paper.