

Explore institutional insights


Funded status increased 2.6% in December due to a rise in discount rates and rally in equities
December Market Summary
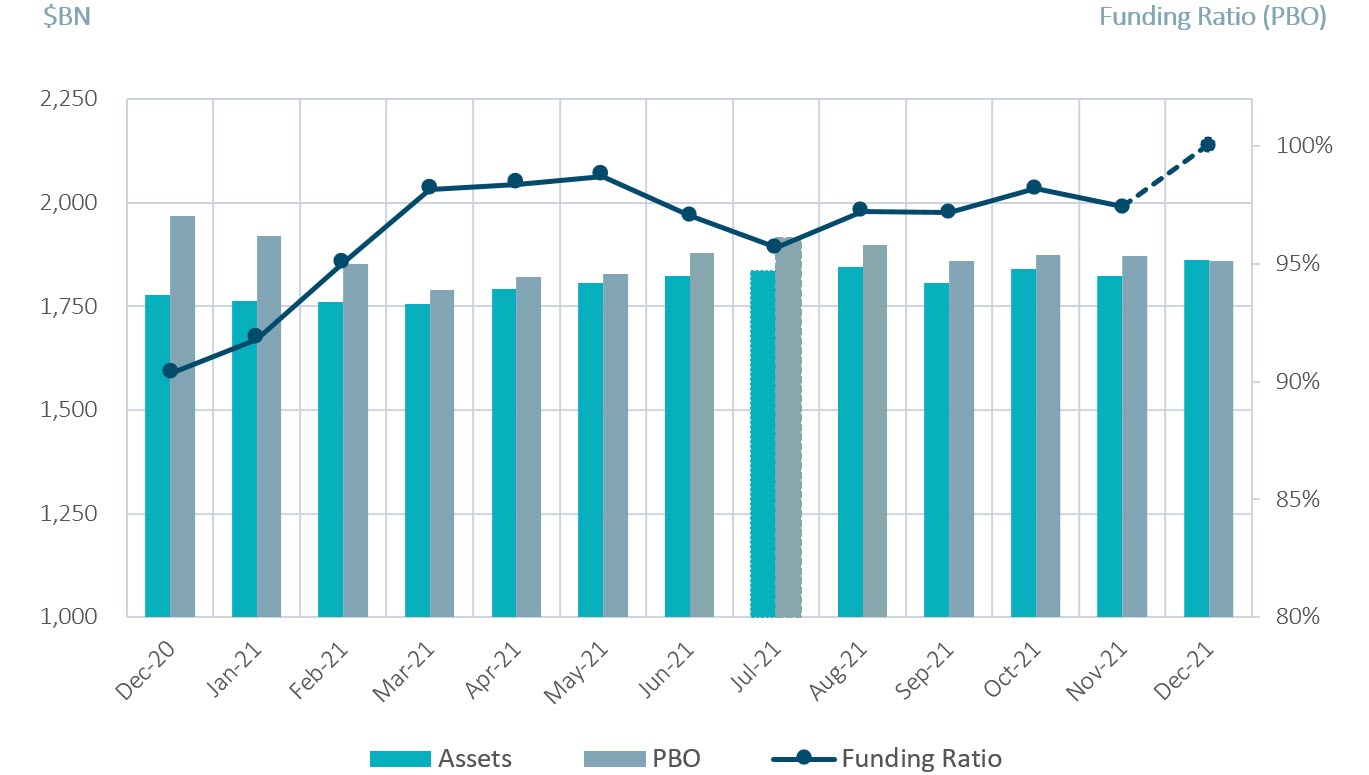
- Average funded status increased by 2.6% to 100.1%: Assets returned 2.1% while a rise in discount rates decreased liabilities by 0.6%.¹
- U.S. equity markets rebounded in December: After falling 0.8% in November, the S&P 500 Index rose 4.4% in December and ended the calendar year higher by 26.9%.
- The yield on the Bloomberg Barclays Long Credit Index increased 5 basis points (bps): Long credit spreads tightened 5 bps while the underlying Treasury basis increased 10 bps.
| Market Watch | Dec 2019 | Dec 2020 | Nov 2021 | Dec 2021 |
|---|---|---|---|---|
| Funded status | 90% | 90% | 97% | 100% |
| CITI discount rate2 | 3.01% | 2.23% | 2.56% | 2.62% |
| Long Credit yield2 | 3.63% | 2.78% | 3.05% | 3.10% |
| U.S. 30Y TSY yield | 2.39% | 1.64% | 1.79% | 1.90% |
| S&P 500 | 3,231 | 3,756 | 4,567 | 4,766 |
Spotlight: What a year
- 2021 was another eventful year for pension plan sponsors. While buoyant equity markets continued to drive returns, with the S&P 500 up 26.9%, a moderate uptick in discount rates also contributed to a strong year of funded status improvements. The average pension plan funded status improved from 90% at the end of 2020 to 100% at the end of 2021. ¹
- As a result, pension buyout volumes were elevated this year, with an estimated $35B of transactions pricing over the course of 2021.²
- Many plan sponsors took the opportunity to de-risk their plans and lock in these funded status gains. Flows into liability hedging portfolios led to an increased interest in credit alternatives such as investment grade private credit, as sponsors looked to diversify their portfolios.
- Loose monetary policy which originated as a Covid response continued into 2021, where M2 expanded by 13% and the Fed continued to purchase $120BN per month of Treasuries and Agency MBS before finally announcing a taper plan in late November.
- Debt/GDP now stands at 130%, the highest figure since World War 2, while daily reverse REPO is now $1.7TN, a sign of excess liquidity in the market.
- In credit markets, we saw another year of robust issuance, with roughly $1.4T of Investment Grade bond issuance and $500MM of High Yield issuance.
- Private markets remained attractive as SLC Management’s investment grade private credit earned 86 bps of excess spread in long deals and 152 bps in intermediate versus similar rated public credit, highlighting the benefits of a well-diversified hedging portfolio. ³
- Simultaneously, supply chain disruptions have caused inflation to spike to its highest level since 1982, rising to 6.8% YoY. The economy saw a cascading wave of price spikes rotating through different sectors, from lumber to used cars, beef, and coffee.
- Inflation fears and uncertainty about the Fed’s reaction has caused rates market to whipsaw, with the 10-year rate swinging 36 bps intra-quarter in Q4.
- While some believe it is important for the Fed to step-up against rising inflation, others feel the Fed would be overly aggressive given our fiscal position and result in a policy error.
- During this uncertain macroeconomic climate, it is especially important to have an active manager that can help navigate unchartered waters without relying on getting macro calls correct.
Milliman Pension Funding Index (December Estimate)
¹ Funded Status for the month is estimated and subject to change as final numbers are released. Data from reference Bloomberg Indices.
² The Long Credit yield corresponds to the Bloomberg Long Credit Index. The CITI discount rate corresponds to the FTSE short pension liability index. Source: Mercer.
³ The relative value over public benchmarks estimate is derived by comparing each loan’s spread at funding with a corresponding public corporate bond benchmark based on credit rating. Loans that are internally rated as “AA” are compared to the Bloomberg Barclays U.S. Corporate Aa Index, loans rated “A” are compared to the Bloomberg Barclays U.S. Corporate A Index, while loans rated “BBB” are compared to the Bloomberg Barclays U.S. Corporate Baa Index. For certain power and utility project loans, a best fit approach of a variety of Bloomberg Barclays’ indices was employed prior to September 30, 2016. After this date, these types of loans were compared to Bloomberg Barclays Utilities A Index and Bloomberg Barclays Utilities Baa Index, for “A” and “BBB” internally rated loans, respectively. Relative spread values obtained through the above methodologies were then aggregated and asset-weighted (by year) to obtain the overall spread value indicated in the article. Investment-grade credit ratings of our private placements portfolio are based on a proprietary, internal credit rating methodology that was developed using both externally-purchased and internally developed models. This methodology is reviewed regularly. More details can be shared upon request. There is no guarantee that the same rating(s) would be assigned to portfolio asset(s) if they were independently rated by a major credit ratings organization.