Explore institutional insights
Continued decline in yields further decreases funded status
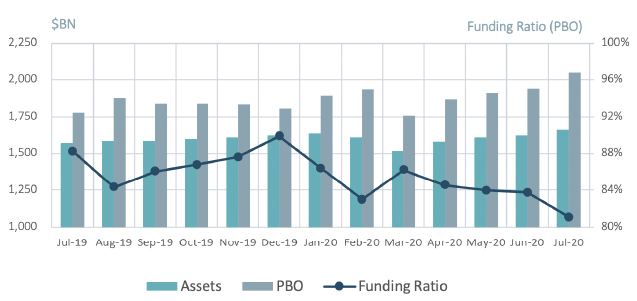
Despite positive asset gains, funded status continued to fall as discount rates plunged
- Average funded status was down by 2.4% over the month: Assets returned 2.9%, offset by a 5.9% increase in liabilities.
- S&P 500 turns positive for 2020: The S&P 500 rose another 5.5% in July and is now up 1.2% for the year.
| Market Watch | Dec 2018 | Dec 2019 | June 2020 | July 2020 |
|---|---|---|---|---|
| Funded Status | 87% | 90% | 84% | 81% |
| CITI Discount Rate1 | 4.05% | 3.01% | 2.38% | 2.02% |
| Long Credit Yield1 | 4.89% | 3.63% | 3.16% | 2.78% |
| U.S. 30Y TSY Yield | 3.02% | 2.38% | 1.41% | 1.20% |
| S&P 500 | 2,507 | 3,231 | 3,100 | 3,271 |
- The yield on the Bloomberg Barclays Long Credit Index declined by 38 basis points (bps): A 19 bps tightening of long credit spreads coupled with a 21 bps decline in the 30Y Treasury drove Long Credit yields down.
- Within Investment Grade (IG) credit, spreads continued to narrow: IG credit markets tightened in July, finishing the month at 126 bps, a 16 bps decline month-over-month and a staggering 215 bps decline from the March wides.2
- Corporate issuance slows sharply – U.S. IG corporates issuance was $76BN in July, compared to four consecutive months above $200BN from March to June.
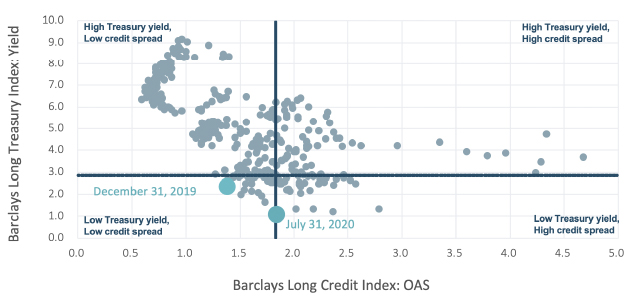
Long credit spreads vs. long Treasury yields

Spotlight: Credit spreads hedging in a low interest rate environment
- For DB plans that discount liabilities using corporate bond yields, hedging funded status risk typically focuses on both Treasury rate and credit spread volatility. Traditionally, an underweight to broad interest rate duration has been the largest driver of volatility. However, in the current low rate environment, credit spreads increasingly make up a greater proportion of overall yield and a more significant driver of volatility.
- As of July 31, credit spread accounted for 66% of the Long Credit index yield. This is a much higher figure compared to just 23% 20 years ago and 34% in 2010.
- During the Covid-19 market sell off and subsequent recovery, 10 year Treasury yields rallied 111 bps peak to trough and have hovered between 0.5% - 0.8% ever since. In contrast, long-end spreads were much more volatile as they blew-out by 215 bps during the sell off and have since rallied 181 bps from the wides.
- We have also seen a downward migration in credit quality. BBB-rated bonds now account for about 50% of the IG long credit index compared to 35% 20 years ago.
- Plan sponsors may want to re-evaluate both whether their overall credit exposure is sufficient to meet their hedging needs and the composition of their credit hedging assets.
- Alternative sources of spread exposure such as IG private credit is one way sponsors could potentially reduce surplus volatility while maintaining high quality credit exposure.
Milliman Pension Funding Index

1The CITI discount rate corresponds to the FTSE short pension liability index. The Long Credit yield corresponds to the Bloomberg Barclays Long Credit Index.
2Data from reference Bloomberg Barclays Indices


