

Explore institutional insights


Funded status falls due to negative investment performance
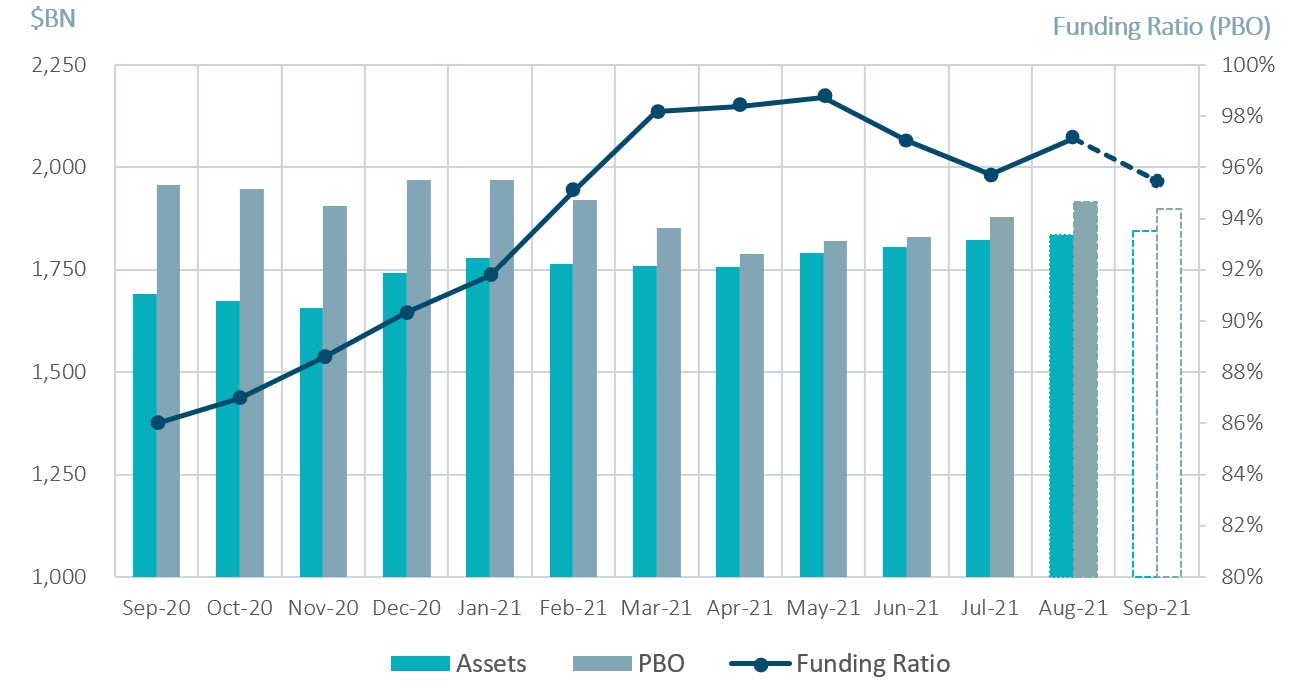
September Market Summary
- Average funded status decreased by 1.6% to 95.5%: Assets returned -3.3% while an increase in discount rates decreased liabilities by 1.6%¹.
- U.S. equity markets fell for the first time since January 2021: The S&P 500 declined by 4.8% in September. Year- to-date the index is up 14.7%.
- The yield on the Bloomberg Barclays Long Credit Index increased 15 basis points (bps): Long credit spreads tightened 2 bps while the underlying Treasury basis increased 17 bps¹.
| Market Watch | Dec 2019 | Dec 2020 | Aug 2021 | Sep 2021 |
|---|---|---|---|---|
| Funded status | 90% | 90% | 97% | 95% |
| CITI discount rate2 | 3.01% | 2.23% | 2.50% | 2.63% |
| Long Credit yield2 | 3.63% | 2.78% | 2.98% | 3.13% |
| U.S. 30Y TSY yield | 2.39% | 1.64% | 1.93% | 2.04% |
| S&P 500 | 3,231 | 3,756 | 4,523 | 4,308 |
Spotlight: Multi-employer pension plan relief, with strings attached
How does the SFA program for multi-employer plans work?
- The Special Financial Assistance (SFA) program aims to top-up underfunded multi-employer plans and nudge them towards a liability driven investment approach.
- However, the relief could be less than anticipated due to discount rate assumptions and the benefits could be short-lived due to restrictions on how the assets can be invested.
- Under the American Rescue Plan Act (ARPA), plans would receive a lump sum to help cover expected benefit payments (liabilities) through 2051, essentially making each plan “fully funded”.
- The funds are to be invested in public investment grade fixed income, with a small sleeve (5%) reserved for downgrades post investment. The public market requirement also means that private credit is not permitted, even if it is investment grade. Derivative use is required to maintain a similar duration exposure that a cash bond portfolio could achieve.
Why it’s good, but not perfect
- The SFA funds will be issued based on a liability discount rate that could be ~2% higher than the rate at which the assets can be invested, the 2% estimate is based on the cap defined by the PBGC.
- Plan sponsors are therefore topped-up to “full funding” based on a lower liability present value (resulting from the higher discount rate). This means they may receive insufficient assets to be fully funded on a mark-to-market basis.
- In addition, the invested assets may struggle to keep pace with the artificially high discount rate, eroding funded status further over time.
What should plan sponsors do and how can SLC Management help?
- The key for plan sponsors is to balance the competing needs of liability hedging and closing that 2% yield gap within the investment restrictions.
- In the fixed income portfolio, it may mean an additional focus on corporate bonds & active management, as low yielding Treasuries and passive management accentuate the yield differential.
- It may also require plan sponsors to reposition non-SFA assets to account for the more conservative investment of the SFA assets. In this case, investments in alternative higher yielding assets such as private fixed income, real estate debt or infrastructure debt may prove beneficial.
Milliman Pension Funding Index (September Estimate)
¹Funded Status for the month of September is estimated and subject to change as final numbers are released. Data from reference Bloomberg Barclays Indices.
²The CITI discount rate is estimated for the month of September based on the change in the Bloomberg Long AA corporate Index. The Long Credit yield corresponds to the Bloomberg Long Credit Index.
Investment grade credit ratings of our private placement’s portfolio are based on a proprietary, internal credit rating methodology that was developed using both externally purchased and internally developed models. This methodology is reviewed regularly. More details can be shared upon request. Although most U.S. dollar private placement investments have an external rating, for unrated deals, there is no guarantee that the same rating(s) would be assigned to portfolio asset(s) if they were independently rated by a major credit ratings organization.
The relative value over public benchmarks estimate is derived by comparing each loan’s spread at funding with a corresponding public corporate bond benchmark based on credit rating. Loans that are internally rated as “AA” are compared to the Bloomberg Barclays U.S. Corporate Aa Index, loans rated “A” are compared to the Bloomberg Barclays U.S. Corporate A Index, while loans rated “BBB” are compared to the Bloomberg Barclays U.S. Corporate Baa Index. For certain power and utility project loans, a best fit approach of a variety of Bloomberg Barclays’ indices was employed prior to September 30, 2016. After this date, these types of loans were compared to Bloomberg Barclays Utilities A Index and Bloomberg Barclays Utilities Baa Index, for “A” and “BBB” internally rated loans, respectively. Relative spread values obtained through the above methodologies were then aggregated and asset-weighted (by year) to obtain the overall spread value indicated in the paper.