


Market
Estimated U.S. investment grade private credit (IGPC) volume for the first quarter of 2021 was $17.8 billion, based on 69 reported transactions. This represented a more than 60% increase from 1Q20 volume of $11 billion, which was significantly curtailed by the onset of the coronavirus pandemic.
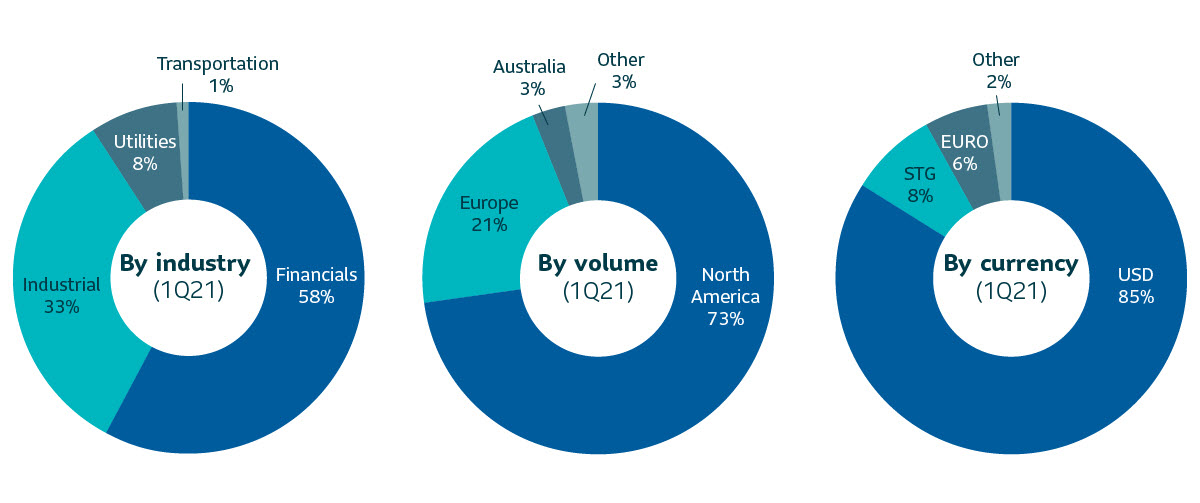
Volume for the quarter was driven predominately by non-bank financial issuers, including REITs. Non-bank financials accounted for over 50% of the reported volume, as issuers such as alternative asset managers and investment funds continued to tap liquidity in the private markets. Volume for the quarter also saw a continuation of the ongoing trend in favor of higher quality USD issuers. North American issuers accounted for almost 75% of volume in 1Q21 (v.s 50% in 1Q20), while issuers of USD accounted for 85% of the total. The bias in favor of A rated issues (NAIC-1) moderated somewhat in 1Q21, as issues rated BBB or better (NAIC-2) accounted for 58% of the volume, compared to about 50% in 2020. Historically, the private market’s long-term average has been around 60-65% in favor of issues rated BBB.
With respect to pricing, private credit spreads – along with the public market – continued to tighten in 1Q21 from the peaks experienced in March and April of 2020. In many cases, spreads are close to or inside pre-Covid levels, but with higher Treasury rates and overall yields that are higher than pre-crisis levels. Spread tightening in the private market generally followed the public bond market, but private spreads maintained a solid premium to publics in 1Q21.
| 1Q20 | 1Q21 | yoy %chg | |
|---|---|---|---|
| Total volume | 11,049 | 17,881 | 62% |
| NAIC 1 | 3,931 | 7,533 | 92% |
| NAIC 2 | 7,069 | 10,178 | 44% |
| USD volume | 8,656 | 15,127 | 75% |
| Non-USD volume | 2,394 | 2,754 | 15% |
| North America | 5,393 | 13,058 | 142% |
| Outside North America | 5,657 | 4,823 | -15% |
| Cross border | 5,957 | 5,004 | -16% |
| Delayed takedown | 722 | 3,210 | 345% |
| # issuers | 51 | 69 | 18 |
SLC Management
SLC Management activity through 1Q21 was strong, with just over $1 billion in USD equivalent transactions. The investments reflected a healthy mix of well-priced broadly marketed transactions and higher value club/proprietary transactions. SLC Management transactions averaged an 11-year weighted average life, an average UST equivalent spread of 226 bps. In terms of quality, the mix between A and BBB for the quarter was 51% and 49% respectively.
Outlook
Looking forward to Q2, we expect the rebound in U.S. economic activity to support continued issuance in the private market. While private spreads have generally tightened relative to publics, we at SLC Management continue to see the value of more bespoke opportunities with borrowers in sectors where we have a knowledge and sourcing or a relationship advantage.
| Q121 | Avg WAL | Avg rating | Avg spread |
|---|---|---|---|
| Private placement market | 12 yrs | 42%: A 58%: BBB |
194 |
| SLC Management | 11 yrs | 51%: A 49%: BBB |
226 |
SLC Management figures based on USD Fixed Rate Commitments
Source: Private placement market data is calculated internally based on external market data sourced from Private Placement Monitor
Investment grade credit ratings of our private placements portfolio are based on a proprietary, internal credit rating methodology that was developed using both externally-purchased and internally developed models. This methodology is reviewed regularly. More details can be shared upon request. Although most U.S. dollar private placement investments have an external rating, for unrated deals, there is no guarantee that the same rating(s) would be assigned to portfolio asset(s) if they were independently rated by a major credit ratings organization.
The relative value over public benchmarks estimate is derived by comparing each loan’s spread at funding with a corresponding public corporate bond benchmark based on credit rating. Loans that are internally rated as “AA” are compared to the Bloomberg Barclays U.S. Corporate Aa Index, loans rated “A” are compared to the Bloomberg Barclays U.S. Corporate A Index, while loans rated “BBB” are compared to the Bloomberg Barclays U.S. Corporate Baa Index. For certain power and utility project loans, a best fit approach of a variety of Bloomberg Barclays’ indices was employed prior to September 30, 2016. After this date, these types of loans were compared to Bloomberg Barclays Utilities A Index and Bloomberg Barclays Utilities Baa Index, for “A” and “BBB” internally rated loans, respectively. Relative spread values obtained through the above methodologies were then aggregated and asset-weighted (by year) to obtain the overall spread value indicated in the paper.
In focus: Understanding Investment Grade Private Credit (IGPC): Three reasons IGPC is more liquid than you might have assumed
1. The secondary market is alive and well
The traditional perception of credit market liquidity is that public fixed income has an active primary and secondary market, while private fixed income does not: it is purchased at issuance, held until maturity and never seen again. The truth is that there is an active secondary market in private fixed income. There are no live CDS prices on Bloomberg for investors to arbitrage or hourly dealer runs on the latest pricing, but an active secondary market exists where the bid ask is often only a couple BPs more for liquid names. $10 million blocks can typically change hands without any issues, and $50 million to $100 million can sell in a matter of days, with approximately $3 billion to $4 billion changing hands on the secondary market each year.
The most direct method is typically via other lenders that are already holders of the original deal. This relatively small group of lenders – that already own and are familiar with the credit – are happy to take down an additional allocation and add to their position.
Sellers can reach a broader secondary market through two key brokers; StoneCastle and Seaport Capital, that also act as third-party pricing agents. The lower volume of secondary in IGPC is typically not a result of a lack of willing buyers. Instead, its more limited nature is fueled by a lack of sellers looking to reduce exposure to attractive deals. With large insurers making up most traditional lenders with a buy-and-hold mentality, there is a strong asymmetry between the number of buyers who are interested in a credit and the relatively few willing sellers.
Liquidity can also vary uniquely by sector. For instance, financial sponsor led deals might come with restricted buyers lists, because the sponsors do not want to reveal their positions to their competitors. As a result, this can reduce the potential secondary market on these deals. Lenders should factor this into their assessment of relative value to ensure they are being appropriately compensated.
2. The greatest liquidity in the secondary market is often with familiar names that trade frequently
Another factor contributing to the liquidity of IGPC is that the issuers and underlying assets are not as esoteric as people think. Similar to regular issuers on the public markets, there are familiar issuers on the private side who tap the market regularly. Having already done the research and due diligence, it is relatively easy for an investor to agree to a secondary market trade. Major League Baseball (MLB) has issued regularly on the private market for over a decade, providing a large base of investors to trade with in the secondary market. For familiar names, transactions can be completed at a competitive rate, even on the same day offers are made.
The aforementioned insurer-heavy investor base also has its advantages during distressed markets. Being book yield focused and less impacted by daily mark-to-market, there are fewer cases of distressed sells from levered buyers in a sell-off. During the 1Q20 Covid sell-off, spreads widened but the market did not see stress selling. In fact, there was strong issuance of over $100 billion, which buoyed market liquidity.
3. Where applicable, a capital efficient fund structure can significantly improve liquidity by crossing flows and providing greater
Compared to a separate account, investors in IGPC funds gain additional liquidity benefits from fund flows, the liquidity sleeve and diversification.
Due to capacity constraints in the private credit market, many funds establish a queue for investors waiting to enter the vehicle. The most natural source of liquidity is to cross the inflows with the outflows, simply transferring ownership from those looking to exit with those looking to add exposure.
Additionally, IGPC funds often hold a small sleeve of public fixed income to help manage duration. If needed, this can provide an additional source of liquidity buffer to use before selling private credit holdings.
Finally, in a diversified IGPC portfolio, PMs have discretion to sell the most liquid names first, such as the aforementioned MLB. This might even be slightly positive for the remaining fund holders, as it allows the fund to maximize yield by maintaining access to less-liquid, higher-yielding names.
Data presented in this article has been calculated internally based on external market data sourced from Private Placement Monitor.
Investment grade credit ratings of our private placements portfolio are based on a proprietary, internal credit rating methodology that was developed using both externally-purchased and internally developed models. This methodology is reviewed regularly. More details can be shared upon request. Although most U.S. dollar private placement investments have an external rating, for unrated deals, there is no guarantee that the same rating(s) would be assigned to portfolio asset(s) if they were independently rated by a major credit ratings organization.
The information in this paper is not intended to provide specific financial, tax, investment, insurance, legal or accounting advice and should not be relied upon and does not constitute a specific offer to buy and/or sell securities, insurance or investment services. Investors should consult with their professional advisors before acting upon any information contained in this paper.
SLC Management is the brand name for the institutional asset management business of Sun Life Financial Inc. (“Sun Life”) under which Sun Life Capital Management (U.S.) LLC in the United States, and Sun Life Capital Management (Canada) Inc. in Canada operate. Sun Life Capital Management (Canada) Inc. is a Canadian registered portfolio manager, investment fund manager, exempt market dealer and in Ontario, a commodity trading manager. Sun Life Capital Management (U.S.) LLC is registered with the U.S. Securities and Exchange Commission as an investment adviser and is also a Commodity Trading Advisor and Commodity Pool Operator registered with the Commodity Futures Trading Commission under the Commodity Exchange Act and Members of the National Futures Association. Registration as an investment adviser does not imply any level of skill or training. There is no assurance that the objective of any private placement strategy can be achieved. As with any strategy, the Advisor’s judgments about the relative value of securities selected for the portfolio can prove to be wrong.
The relative value over public benchmarks estimate is derived by comparing each loan’s spread at funding with a corresponding public corporate bond benchmark based on credit rating. Loans that are internally rated as “AA” are compared to the Bloomberg Barclays U.S. Corporate Aa Index, loans rated “A” are compared to the Bloomberg Barclays U.S. Corporate A Index, while loans rated “BBB” are compared to the Bloomberg Barclays U.S. Corporate Baa Index. For certain power and utility project loans, a best fit approach of a variety of Bloomberg Barclays’ indices was employed prior to September 30, 2016. After this date, these types of loans were compared to Bloomberg Barclays Utilities A Index and Bloomberg Barclays Utilities Baa Index, for “A” and “BBB” internally rated loans, respectively. Relative spread values obtained through the above methodologies were then aggregated and asset-weighted (by year) to obtain the overall spread value indicated in the paper.
Unless otherwise stated, all figures and estimates provided have been sourced internally and are as of December 31, 2020. Unless otherwise noted, all references to “$” are in U.S. dollars.
This document may present materials or statements which reflect expectations or forecasts of future events. Such forward-looking statements are speculative in nature and may be subject to risks, uncertainties and assumptions and actual results which could differ significantly from the statements. As such, do not place undue reliance upon such forward-looking statements. All opinions and commentary are subject to change without notice and are provided in good faith without legal responsibility. Unless otherwise stated, all figures and estimates provided have been sourced internally and are current as at the date of the paper unless separately stated. All data is subject to change.
No part of this material may, without SLC Management’s prior written consent, be (i) copied, photocopied or duplicated in any form, by any means, or (ii) distributed to any person that is not an employee, officer, director, or authorized agent of the recipient.
© 2021, SLC Management

