


Steve’s take: “As of September, Canadian headline CPI was up 6.9% year-over-year and 0.1% month-over-month (chart 1). While the year-over-year figure marks the third consecutive monthly slowdown in headline inflation, the month-over-month increase exceeded market consensus of a 0.1% decline, indicating that the Bank of Canada may need to continue taking action to tame inflation.”
Food purchased from grocery stores accounts for 1.3% of the 6.9% year-over-year inflation (chart 2), driven by an 11.4% year-over-year increase in prices. Food purchased from stores remains among the top contributors to both year-over-year and month-over-month inflation.
Private transportation accounts for 1.3% of year-over-year inflation, representing a smaller proportion of overall inflation compared to Q2. This was primarily due to falling gasoline prices (-7% month-over-month). Price decelerations in this category have been a large contributor to the deceleration in overall year-over-year inflation.
Shelter had a 2.1% contribution to year-over-year inflation in September. Shelter costs increased 0.5% month-over-month, the fastest pace since May. Much of this came from a 2.8% month-over-month increase in mortgage interest costs which is the largest increase in decades. Rents and homeowner replacement costs were both little changed.
Chart 1: CPI Change
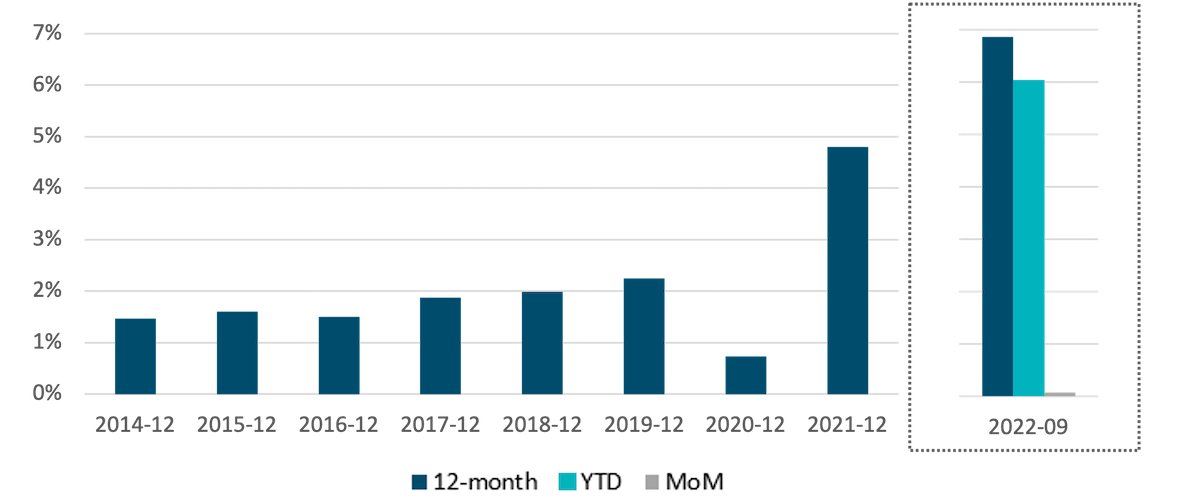
Chart 2: Canada headline CPI contribution year-over-year

Steve’s take: “In its Fall Economic Statement 2022, released on November 3, the Government of Canada announced its decision to cease issuance of real return bonds (RRBs) effective immediately. Plans with existing RRB allocations backing liabilities could consider holding these positions to maturity as they should continue to provide a good hedge to their liabilities. To supplement their inflation hedge going forward, plans may look to use U.S. Treasury inflation-protected securities (TIPS), U.S. inflation swaps or real assets, depending on their objectives and risk tolerances.”
Chart 3: 3-Month Real Estate Returns vs. Changes in Canada and U.S. CPI

Historically, inflation has tended to follow similar dynamics in both Canada and the U.S., with similar CPI movements in both countries (chart 3). This suggests that U.S. TIPS and inflation swaps may be a potential option going forward for investors wishing to hedge liabilities linked to Canadian inflation. Despite some variability between real estate investment returns and CPI movements observed quarter-over-quarter, real estate has historically shown stronger correlation with changes in inflation over longer holding periods.
$1B of 2054 Federal RRBs were auctioned in 2022 (chart 4). RRB issuance by the Government of Canada was generally higher pre-COVID, but has slowed since. Prior to cancellation of the December auction, RRB issuance levels in 2022 were expected to match 2021.
Chart 4: Federal Real Return Bonds auctioned ($B)

FOR MORE INFORMATION: SLC.info@sunlife.com
The content of this presentation is intended for institutional investors only. It is not for retail use or distribution to individual investors. All investments involve risk including the possible loss of capital. This presentation is for informational and educational purposes only. Past performance is not a guarantee of future results.
Unless otherwise stated, all figures and estimates provided have been sourced from the Bank of Canada. Unless otherwise noted, all references to “$” are in CAD. Any reference to a specific asset does not constitute a recommendation to buy, sell or hold or directly invest in it. It should not be assumed that the recommendations made in the future will be profitable or will equal the results of the assets discussed in this document.
The information contained in this presentation is not intended to provide specific financial, tax, investment, insurance, legal or accounting advice and should not be relied upon and does not constitute a specific offer to buy and/or sell securities, insurance or investment services. Investors should consult with their professional advisors before acting upon any information contained in this presentation.
The information may present materials or statements which reflect expectations or forecasts of future events. Such forward-looking statements are speculative in nature and may be subject to risks, uncertainties and assumptions and actual results which could differ significantly from the statements. As such, do not place undue reliance upon such forward-looking statements. All opinions and commentary are subject to change without notice and are provided in good faith without legal responsibility.
SLC Management is the brand name for the institutional asset management business of Sun Life Financial Inc. (“Sun Life”) under which Sun Life Capital Management (U.S.) LLC in the United States, and Sun Life Capital Management (Canada) Inc. in Canada operate.
Sun Life Capital Management (Canada) Inc. is a Canadian registered portfolio manager, investment fund manager, exempt market dealer and, in Ontario, a commodity trading manager. Sun Life Capital Management (U.S.) LLC is registered with the U.S. Securities and Exchange Commission as an investment adviser and is also a Commodity Trading Advisor and Commodity Pool Operator registered with the Commodity Futures Trading Commission under the Commodity Exchange Act and Members of the National Futures Association. In the U.S., securities are offered by Sun Life Institutional Distributors (U.S.) LLC, an SEC registered broker-dealer and a member of the Financial Industry Regulatory Authority (“FINRA”).
© 2022, SLC Management.
CPI change (chart 1)
12-month, YTD, and MoM change in the Statistics Canada Consumer Price Index, monthly, not seasonally adjusted (Table 18-10-0004-01)
Canada headline CPI contribution year-over-year (chart 2)
Bank of Canada Consumer Price Index Portal
Long-term break-even inflation (chart 3)
Calculated as ((1 + Government of Canada benchmark bond yields, long term [CANSIM V39056]/2)/(1 + Real return benchmark bond yield, long term [CANSIM V39057]/2))^2 – 1.
Break-even inflation curve (%) (chart 4)
Sourced from Bloomberg
Federal Real Return Bonds auctioned ($B) (chart 5)
Bank of Canada Government Securities Auctions, Government of Canada Historical Auction Results, RRB Results
“FTSE®” is a trade mark of FTSE® International Limited and is used under license.
No part of this material may, without SLC Management’s prior written consent, be (i) copied, photocopied or duplicated in any form, by any means, or (ii) distributed to any person that is not an employee, officer, director, or authorized agent of the recipient.
© SLC Management, 2022
SLC-20221031-2564345