


Market
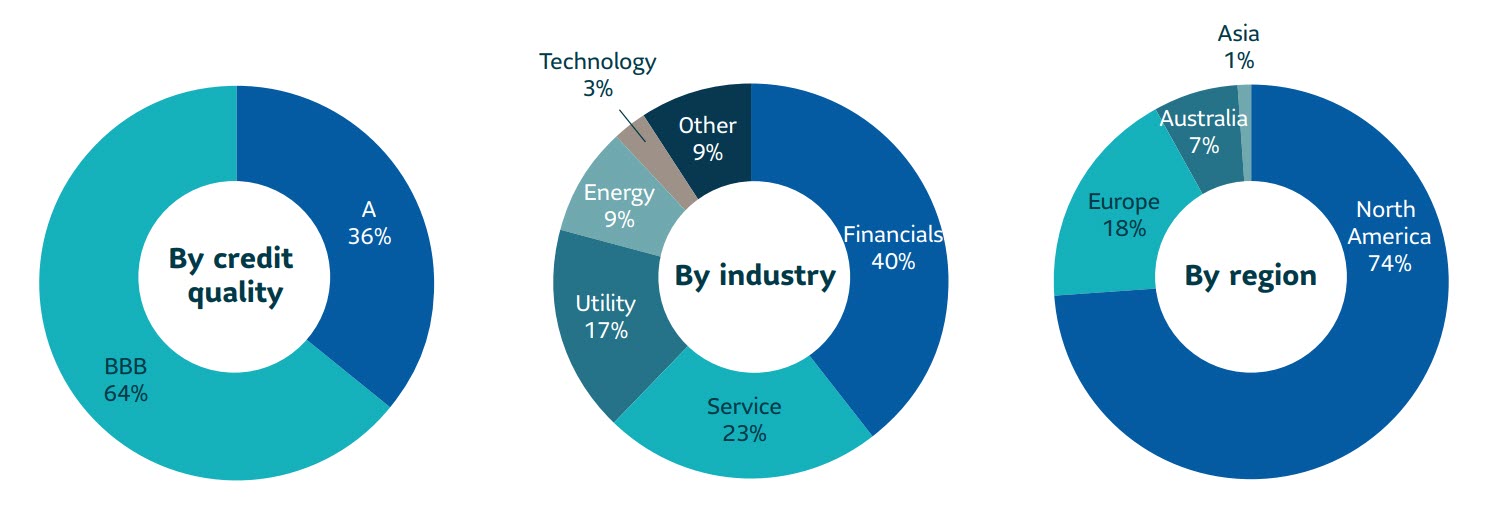
U.S. investment grade private credit (IGPC) volume in Q3 2021 was reported at $24 billion. This was below Q2 2021 issuance of $28 billion but this was expected due to slower markets over the summer months. 2021 year-to-date issuance of $75 billion was approximately 11% higher compared to the same period in 2020, which was a record year for issuance. The increase in YTD volume was driven by financials, which accounted for about 40% of industry volume, and includes issuers such as alternative asset managers, REITs, BDCs, investment companies, and closed-end funds. We expect the trend of robust issuance from this sector to continue, particularly in light of the record amounts of private equity and private debt capital being raised in the market.
Year-to-date 2021 volume continued to be driven by domestic issuance, which totaled approximately 70% of total market issuance, versus 50-60% historically. UK issuance drove a significant part of cross-border transactions. Non-USD volume was 18% vs. 14% in YTD 2020, particularly led by GBP (8% of volume) and Euro (8%) currencies. The volume of NAIC 2 (BBB rated) credits versus NAIC 1 (A3/A- or better) has reverted to pre-pandemic levels and industry norms, around 65%/35% split, compared to the 50%/50% split in 2020. This demonstrates investor comfort with the economic outlook and search for additional yield.
IGPC spreads in Q3 remained flat compared to Q2 and tightened by 20 bps compared to Q1. YTD 2021 IGPC spreads are about 70 bps tighter compared to the same period last year, and are also tighter than pre-pandemic levels across all sectors. Allocations on broadly distributed deals continue to be difficult with issues well oversubscribed.
SLC Management
SLC Management activity for through 3Q21 was strong with $1.4 billion in USD equivalent transactions. Investments reflected a healthy mix of well-priced broadly marketed transactions and higher value club/proprietary transactions. SLC Management transactions averaged an 11-year weighted average life, an average UST equivalent spread of 226 bps. In terms of quality, the mix between A and BBB for the quarter was 51% and 49%, respectively.
Outlook
We are optimistic about the last quarter of 2021 given the ongoing recovery from the pandemic. We expect that attractive opportunities in sectors such as asset managers, infrastructure, and credit tenant leases will continue. While private spreads in general have tightened in 2021, we at SLC Management continue to see value in more bespoke opportunities that are less competitively bid, and where we can leverage our expertise and relationships to maximize allocations.
| Q32021 | Weighted average life | Average rating | Average Spread1 |
|---|---|---|---|
| Private placement market |
12 years | 36%: A 64%: BBB |
126 |
| SLC Management2 | 11 years | 51%:A 49%: BBB |
226 |
Investment grade credit ratings of our private placement’s portfolio are based on a proprietary, internal credit rating methodology that was developed using both externally purchased and internally developed models. This methodology is reviewed regularly. More details can be shared upon request. Although most U.S. dollar private placement investments have an external rating, for unrated deals, there is no guarantee that the same rating(s) would be assigned to portfolio asset(s) if they were independently rated by a major credit ratings organization.
The relative value over public benchmarks estimate is derived by comparing each loan’s spread at funding with a corresponding public corporate bond benchmark based on credit rating. Loans that are internally rated as “AA” are compared to the Bloomberg Barclays U.S. Corporate Aa Index, loans rated “A” are compared to the Bloomberg Barclays U.S. Corporate A Index, while loans rated “BBB” are compared to the Bloomberg Barclays U.S. Corporate Baa Index. For certain power and utility project loans, a best fit approach of a variety of Bloomberg Barclays’ indices was employed prior to September 30, 2016. After this date, these types of loans were compared to Bloomberg Barclays Utilities A Index and Bloomberg Barclays Utilities Baa Index, for “A” and “BBB” internally rated loans, respectively. Relative spread values obtained through the above methodologies were then aggregated and asset-weighted (by year) to obtain the overall spread value indicated in the paper.
In focus: Intermediate duration private credit: an overlooked opportunity
Summary
For many investors in investment grade private credit (IGPC), the focus has traditionally been on longer dated issuance in the 5 to 20-year portion of the curve, where life insurers have historically been the dominant buyers. This structural demand often gives rise to opportunities in the intermediate part of the curve that can be exploited by investors who are either not liability constrained or who wish to match shorter-dated liabilities.
Issuance across the curve
Issuers typically align their borrowing with the life of the funded asset and issue across the curve to spread out debt maturities. For example, professional sports leagues will issue new debt to match the life of multi-year TV contracts.
Issuers in the 3 to 5-year maturity space include financial institutions, REITs, PE firms and asset managers issuing at terms to match the life cycle of their funds. Most corporate issuers are concentrated in the 7 to 15-year maturity bucket, with limited issuance extending beyond 15 years. In the +20-year space, project finance transactions, with long life projects and infrastructure investments are commonplace. Utilities also issue in the +20-year space, although we see less value in those investment opportunities.
Example: Sample private credit deal – priced in July 2020
| Deal Metric | Tenors | |||||
|---|---|---|---|---|---|---|
| 3 Year | 5 Year | 7 Year | 12 Year | 15 Year | 20 Year | |
| Coupon (%) | 2.5% | 2.7% | 3.0% | 3.3% | 3.5% | 3.9% |
| Credit Spread (bps) | 230 | 240 |
250 | 270 | 290 | 275 |
| Spread to comparable public issuer (bps) | +178 | +174 | +160 | +120 | +135 | +87 |
Private vs. public market credit curve comparison
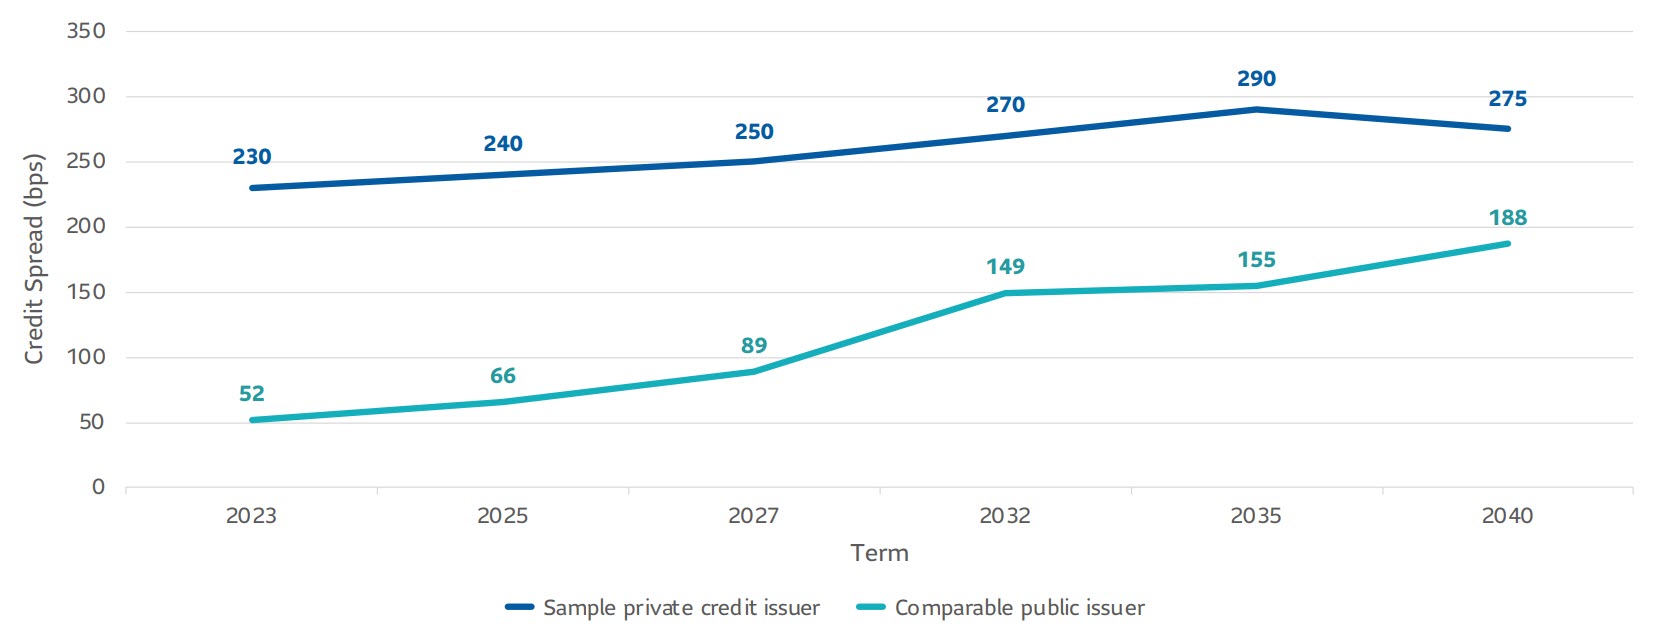
Notes: Public issuer credit spread is based on the closest tenor to each private tranche. Data as of pricing date 7/17/2020. Shown for illustrative purposes only. Calculated internally based on the credit spreads of an A rated media company’s private debt vs. a comparable A rated media company’s public debt. We believe the companies to be comparable on the basis of analogous sector and credit quality between the two issuers.
Structural long end demand
Life insurers have traditionally been dominant buyers in the IGPC market. Favorable capital treatment, insurer’s capacity to hold illiquid assets and additional spread over comparable public bonds can make IGPC extremely attractive to life insurers. Due to the longer duration of liabilities as compared to P&C insurers, life insurers have normally focused on the longer duration end of the IGPC market.
The long end demand from life insurers has created a slight supply/demand imbalance. While issuance occurs across the curve, traditional demand is concentrated in the back end. As a result, the spread curve in the IGPC market is relatively flat, where the spread offered in the 3 to 5-year tranche of a given deal is typically no more than 20 to 30 bps lower than the 7 to 10 year tranche. In the context of intermediate credit, this spread advantage over publics is more meaningful on the front end of the curve where the intermediate corporate index yields just 1.5%.
When compared to equivalent duration public market bonds, intermediate duration IGPC often offers even more relative value than long duration IGPC. SLC Management has historically realized [157 bps] spread advantage over publics for intermediate duration IGPC and [118 bps] for all IGPC*.
SLC Management 3-year average relative value
| Intermediate Private Fixed Income | All Private Fixed Income | |
|---|---|---|
| Spread to Corporates | 157 bps | 118 bps |
| Spread to Treasuries |
294 bps | 236 bps |
*3-year average from 2018-2020
Investment grade credit ratings of our private placement’s portfolio are based on a proprietary, internal credit rating methodology that was developed using both externally purchased and internally developed models. This methodology is reviewed regularly. More details can be shared upon request. Although most U.S. dollar private placement investments have an external rating, for unrated deals, there is no guarantee that the same rating(s) would be assigned to portfolio asset(s) if they were independently rated by a major credit ratings organization.
The relative value over public benchmarks estimate is derived by comparing each loan’s spread at funding with a corresponding public corporate bond benchmark based on credit rating. Loans that are internally rated as “AA” are compared to the Bloomberg Barclays U.S. Corporate Aa Index, loans rated “A” are compared to the Bloomberg Barclays U.S. Corporate A Index, while loans rated “BBB” are compared to the Bloomberg Barclays U.S. Corporate Baa Index. For certain power and utility project loans, a best fit approach of a variety of Bloomberg Barclays’ indices was employed prior to September 30, 2016. After this date, these types of loans were compared to Bloomberg Barclays Utilities A Index and Bloomberg Barclays Utilities Baa Index, for “A” and “BBB” internally rated loans, respectively. Relative spread values obtained through the above methodologies were then aggregated and asset-weighted (by year) to obtain the overall spread value indicated in the paper.
Changing market dynamic
The IGPC market has experienced record new issuance from financial institutions and investment vehicles, which tend to focus on the short and intermediate portion of the curve, as they take advantage of the current loose monetary environment. Concurrently, demand has surfaced from non-traditional IGPC buyers outside of the life insurer space. These new buyers include non-traditional and P&C insurers, which typically have shorter duration profiles than life insurers, and public and corporate pension plans that are looking to diversify their fixed income exposure without going down the risk spectrum.
Intermediate duration IGPC also provides an attractive opportunity for defined benefit (DB) pension plans. Intermediate duration IGPC provides a natural hedge against corporate discount rates while allowing plan sponsors to take advantage of the market dynamic and capture additional yield.
At SLC Management we manage investment grade private credit for investors across the yield curve, offering a variety of investment formats and tailored solutions to meet their risk, return and duration needs.
1 All commitments
2 SLC Management figures based on all commitments
Data presented in this article has been calculated internally based on external market data sourced from Private Placement Monitor.
Investment grade credit ratings of our private placement’s portfolio are based on a proprietary, internal credit rating methodology that was developed using both externally purchased and internally developed models. This methodology is reviewed regularly. More details can be shared upon request. Although most U.S. dollar private placement investments have an external rating, for unrated deals, there is no guarantee that the same rating(s) would be assigned to portfolio asset(s) if they were independently rated by a major credit ratings organization.
The information in this paper is not intended to provide specific financial, tax, investment, insurance, legal or accounting advice and should not be relied upon and does not constitute a specific offer to buy and/or sell securities, insurance or investment services. Investors should consult with their professional advisors before acting upon any information contained in this paper.
SLC Management is the brand name for the institutional asset management business of Sun Life Financial Inc. (“Sun Life”) under which Sun Life Capital Management (U.S.) LLC in the United States, and Sun Life Capital Management (Canada) Inc. in Canada operate. Sun Life Capital Management (Canada) Inc. is a Canadian registered portfolio manager, investment fund manager, exempt market dealer and in Ontario, a commodity trading manager. Sun Life Capital Management (U.S.) LLC is registered with the U.S. Securities and Exchange Commission as an investment adviser and is also a Commodity Trading Advisor and Commodity Pool Operator registered with the Commodity Futures Trading Commission under the Commodity Exchange Act and Members of the National Futures Association. Registration as an investment adviser does not imply any level of skill or training. There is no assurance that the objective of any private placement strategy can be achieved. As with any strategy, the Advisor’s judgments about the relative value of securities selected for the portfolio can prove to be wrong.
The relative value over public benchmarks estimate is derived by comparing each loan’s spread at funding with a corresponding public corporate bond benchmark based on credit rating. Loans that are internally rated as “AA” are compared to the Bloomberg Barclays U.S. Corporate Aa Index, loans rated “A” are compared to the Bloomberg Barclays U.S. Corporate A Index, while loans rated “BBB” are compared to the Bloomberg Barclays U.S. Corporate Baa Index. For certain power and utility project loans, a best fit approach of a variety of Bloomberg Barclays’ indices was employed prior to September 30, 2016. After this date, these types of loans were compared to Bloomberg Barclays Utilities A Index and Bloomberg Barclays Utilities Baa Index, for “A” and “BBB” internally rated loans, respectively. Relative spread values obtained through the above methodologies were then aggregated and asset-weighted (by year) to obtain the overall spread value indicated in the paper.
Unless otherwise stated, all figures and estimates provided have been sourced internally and are as of December 31, 2020. Unless otherwise noted, all references to “$” are in U.S. dollars.
This document may present materials or statements which reflect expectations or forecasts of future events. Such forward-looking statements are speculative in nature and may be subject to risks, uncertainties and assumptions and actual results which could differ significantly from the statements. As such, do not place undue reliance upon such forward-looking statements. All opinions and commentary are subject to change without notice and are provided in good faith without legal responsibility. Unless otherwise stated, all figures and estimates provided have been sourced internally and are current as at the date of the paper unless separately stated. All data is subject to change.
No part of this material may, without SLC Management’s prior written consent, be (i) copied, photocopied or duplicated in any form, by any means, or (ii) distributed to any person that is not an employee, officer, director, or authorized agent of the recipient.
© 2021, SLC Management