


Steve’s take: “We believe that inflation risks are to the upside in both the short and long term. In the short term, rising energy prices, strong wage growth and robust home price appreciation all support the argument that inflation will stay high for longer. Longer term, structural factors, including trends related to demographics and slowing globalization also point to higher inflation.”
January’s 5.1% year over year increase in CPI (chart 1) was the highest in three decades, and was the result of pandemic stimulus, skilled labour shortages, and supply chain constraints. In an attempt to get inflation under control, Bank of Canada governor Tiff Macklem may look to raise rates as early as the first quarter (Source: JPMorgan).
30 year break-even inflation rates fell slightly in January after rising to as high as 1.81% (chart 2) during Q4 2021, their highest level since 2014. These broadly higher break-even inflation levels are reflective of higher levels of expected inflation over the coming years.
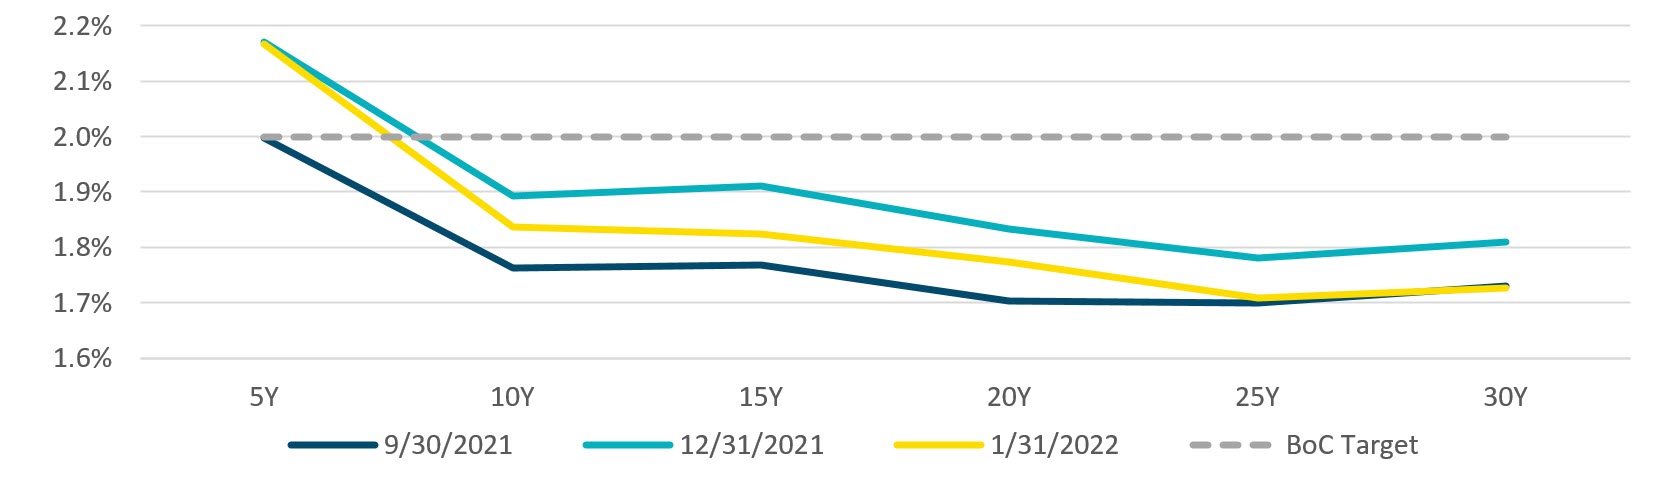
Break-even inflation rates have risen across the curve (chart 3) with the most pronounced increases occurring at the short end of the curve. This is reflective of higher levels of expected CPI over the coming years. However, given the bank of Canada CPI forecasts of 3.0% for 2022 and 2.2% for 2023, and the Bank of Canada’s 2% target, breakeven rates of only between 1.7% and 2.2% suggest that purchasing inflation protection remains attractive.
Chart 1: CPI Change
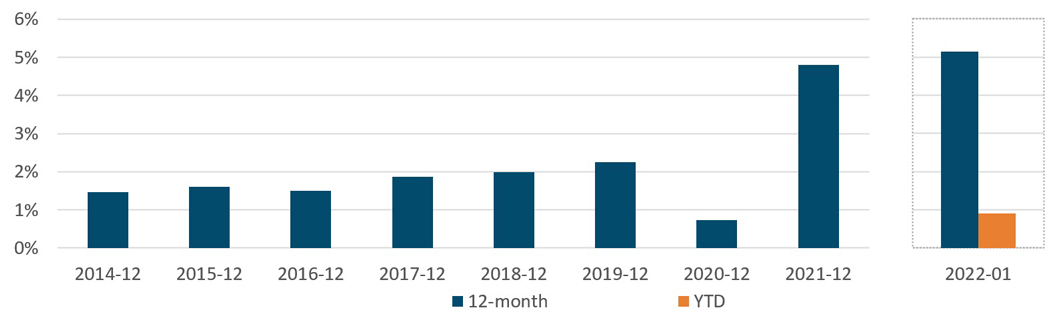
Chart 2: Long-term break-even inflation rate (%)
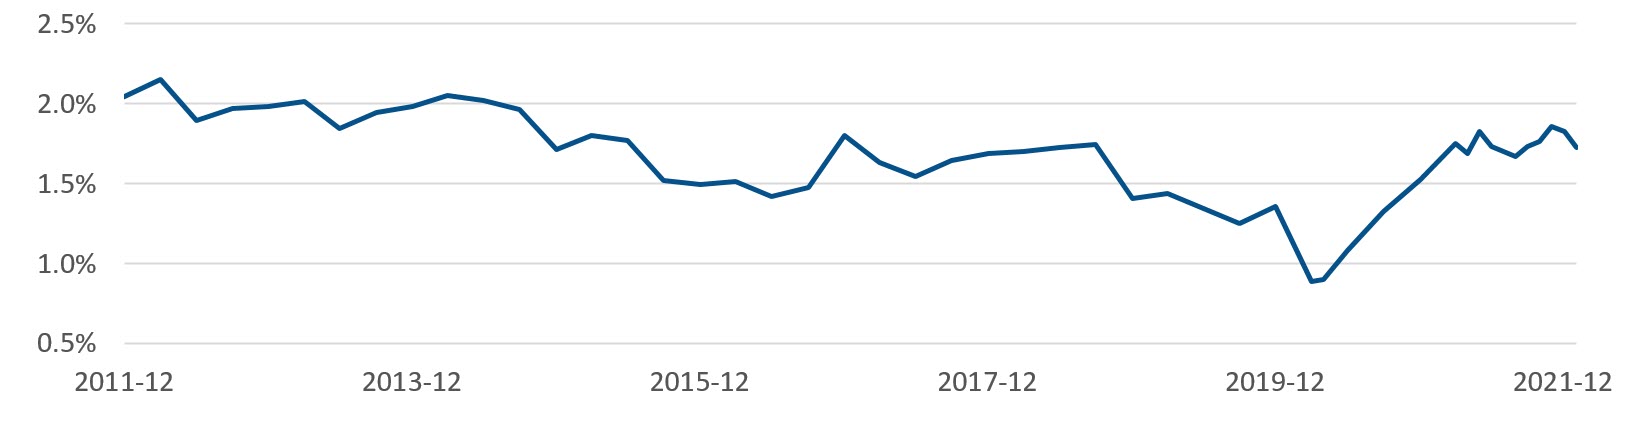
Chart 3: Break-even inflation curve (%)
Steve’s take: “On an asset liability basis, RRB pricing continues to be attractive for indexed plans, as breakeven levels have scope to rally and have positive carry due to high inflation. Pricing is also attractive on an asset only basis. The primary downside risk on RRB pricing is whether the Bank of Canada’s expected interest rate increases are too fast for the economy to handle, prompting a recession that could reduce inflation expectations for a number of years.”
The Bank of Canada held $4.7B of Real Return Bonds (RRBs) on its balance sheet at the end of January (chart 4). This represents approximately 5.4% of the FTSE® RRB Overall Index. The Bank of Canada has announced that they will no longer purchase RRBs as part of quantitative easing. We are closely monitoring the Bank’s plans for these assets.
$0.4B of 2054 Federal RRBs auctioned off on December 1, 2021 (chart 5). In 2021, the Bank of Canada auctioned $1.4B of RRBs, the second lowest amount during the past decade, higher only than 2020. The next auction of 2054 Federal RRBs is on March 9, 2022.
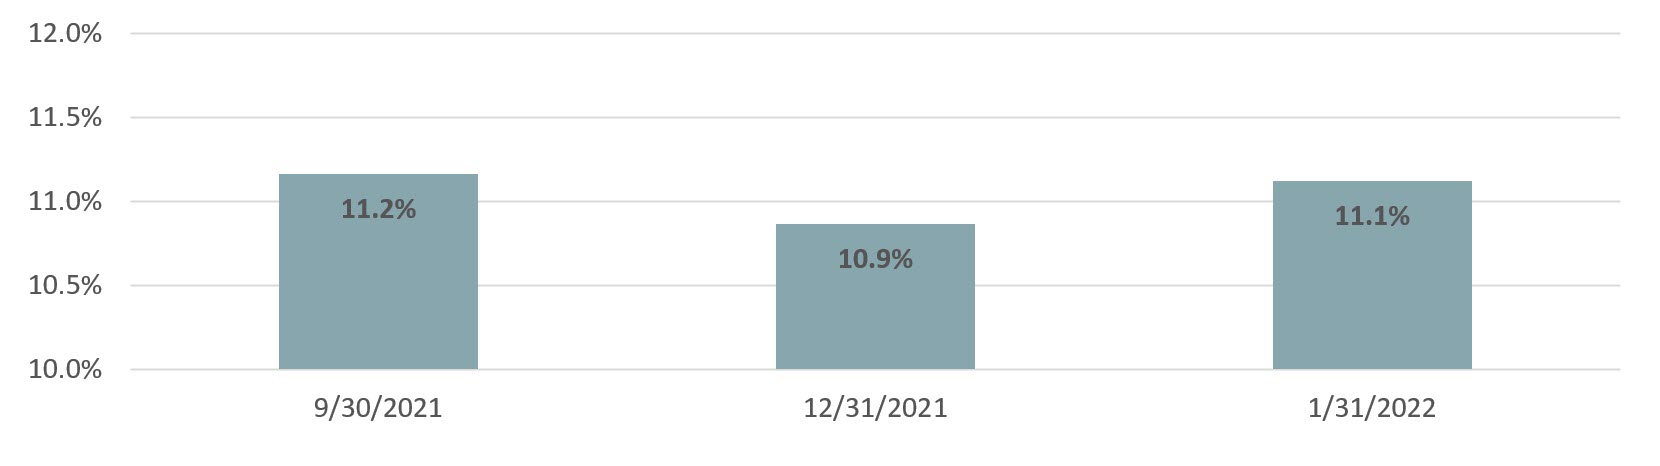
The proportion of Provincial RRBs within the FTSE® RRB Overall Index decreased from 11.2% to 10.9% over Q4 (chart 6), due to the Federal RRB auction in December. Such decreases signal that provincial bonds will likely become available on the secondary markets, as passive fund managers rebalance back to the Overall Index. As there hasn’t been an auction of Provincial RRBs in over a decade, the secondary market remains the best way to access Provincial RRBs.
Chart 4: Real Return Bonds held on Bank of Canada Balance Sheet ($B)
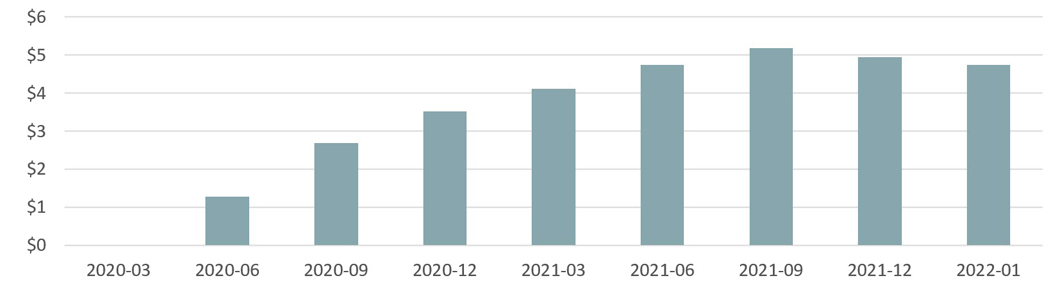
Chart 5: Federal Real Return Bonds Auctioned ($B)
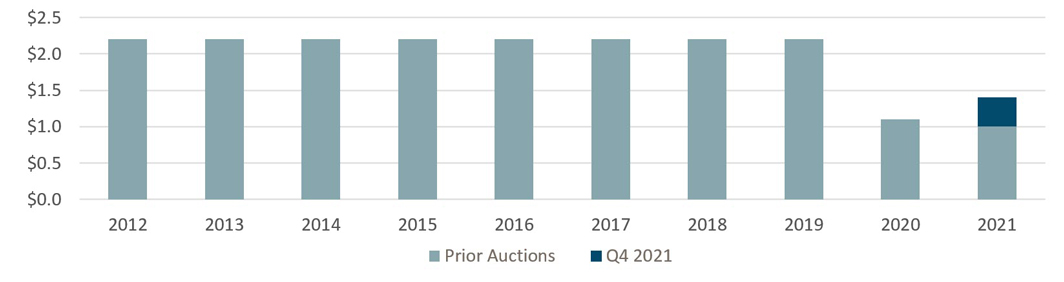
Chart 6: Proportion of Provincial RRBs within the FTSE® RRB Overall Index
FOR MORE INFORMATION: SLC.info@sunlife.com
The content of this presentation is intended for institutional investors only. It is not for retail use or distribution to individual investors. All investments involve risk including the possible loss of capital. This presentation is for informational and educational purposes only. Past performance is not a guarantee of future results.
Unless otherwise stated, all figures and estimates provided have been sourced from the Bank of Canada. The information provided on liquidity is based on internal investment management experience. Unless otherwise noted, all references to “$” are in CAD. Any reference to a specific asset does not constitute a recommendation to buy, sell or hold or directly invest in it. It should not be assumed that the recommendations made in the future will be profitable or will equal the results of the assets discussed in this document.
The information contained in this presentation is not intended to provide specific financial, tax, investment, insurance, legal or accounting advice and should not be relied upon and does not constitute a specific offer to buy and/or sell securities, insurance or investment services. Investors should consult with their professional advisors before acting upon any information contained in this presentation.
Forward-looking statements are speculative in nature and may be subject to risks, uncertainties and assumptions and actual results which could differ significantly from the statements. Do not place undue reliance upon such forward-looking statements.
SLC Management is the brand name for the institutional asset management business of Sun Life Financial Inc. (“Sun Life”) under which Sun Life Capital Management (Canada) Inc. operates in Canada. More information are available at https://www.slcmanagement.com
CPI change (chart 1)
12-month and YTD change in the Statistics Canada Consumer Price Index, monthly, not seasonally adjusted (Table 18-10-0004-01)
Long-term break-even inflation (chart 2)
Calculated as ((1 + Government of Canada benchmark bond yields, long term [CANSIM V39056]/2)/(1 + Real return benchmark bond yield, long term [CANSIM V39057]/2))^2 – 1.
Break-even inflation curve (%) (chart 3)
Sourced from Bloomberg
Real Return Bonds held on Bank of Canada Balance Sheet ($B) (chart 4)
Bank of Canada Weekly Wednesday, Assets, Government of Canada direct and guaranteed securities, Real Return bonds (CANSIM V1160788296)
Federal Real Return Bonds Auctioned ($B) (chart 5)
Bank of Canada Government Securities Auctions, Government of Canada Historical Auction Results, RRB Results
Proportion of Provincial RRBs within the FTSE® RRB Overall Index (chart 6)
Sourced from FTSE Canada
“FTSE®” is a trade mark of FTSE® International Limited and is used under license.
No part of this material may, without SLC Management’s prior written consent, be (i) copied, photocopied or duplicated in any form, by any means, or (ii) distributed to any person that is not an employee, officer, director, or authorized agent of the recipient.
© SLC Management, 2022