


Market update
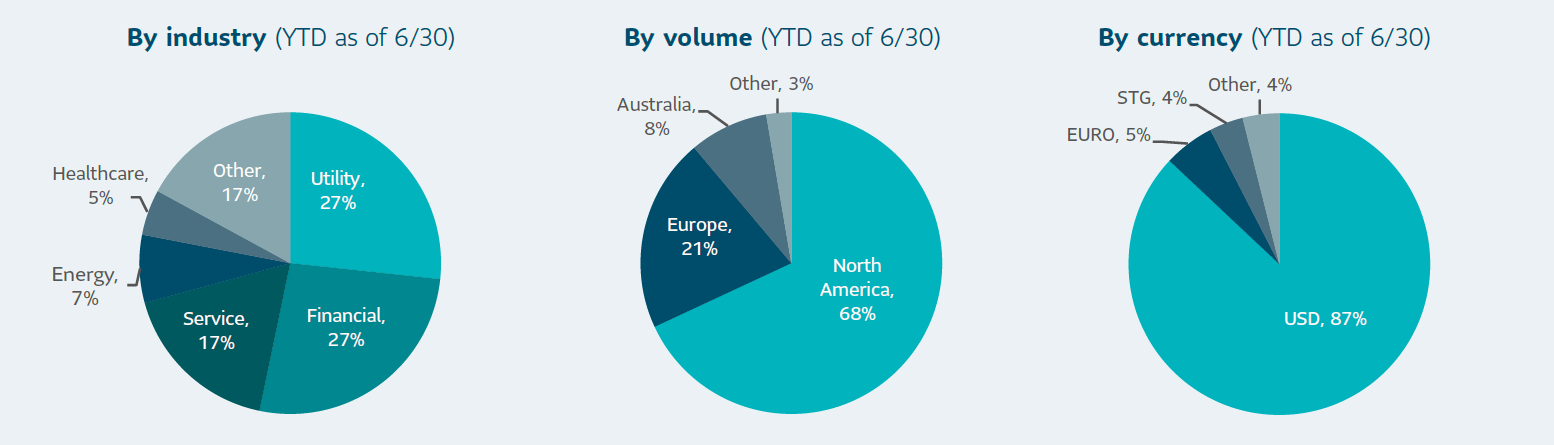
Estimated U.S. investment grade private credit (also referred to as private placements) volume for the first half of 2020 was almost $32 billion, based on 131 reported transactions. This was down roughly 25% compared to the first half of 2019 due to the pandemic-related market disruption. Similar to the public markets, deal flow dried up during March and April before rebounding in May and June as the public markets stabilized in response to various federal stimulus programs1.
While the outlook for the pandemic remains unclear, demand has been strong as investors remain attracted to the incremental yield and structural protections offered by investment grade private credit. The market rebound also opened the door for investors to source attractive deals at significant yield premiums to similarly rated public bonds. Insurance companies and retirement plans all saw an opportunity to add additional spread premium and diversification while retaining a high correlation to long-term financial liabilities.
The uncertainty related to the pandemic has also contributed to an upward shift in credit quality, with the proportion of NAIC-1 rated transactions (A or higher) accounting for 51% of year-to-date volume in 2020, compared to 37% in 2019. Deals denominated in USD accounted for almost 90% of the volume – a larger than usual share – and reflects both the disruption in currency markets and the overall bias in favor of USD issuers2.
Pricing in the private market tends to lag the public markets, which can create opportunities to capture strong relative value. While public investment grade (IG) spreads have tightened significantly from the peak in March, private investment grade spreads have remained attractive on a relative basis. Even oversubscribed deals for high quality issuers have priced wide of the traditional 20-25 basis points (bps) premium to publics, as investors expect greater compensation for providing liquidity in a more uncertain market.
U.S. private placement volume3
¹ Calculated internally based on external market data sourced from Private Placement Monitor
² Private Placement Monitor
³ Private Placement Monitor Datafield
SLC Management update
At SLC Management, we focus on value over volume. We seek to outperform the larger U.S. private placement market by leveraging our broad origination capabilities and unique industry expertise. We are focused on offering our clients proprietary and bespoke opportunities that provide better returns and more favorable allocations compared to broadly marketed transactions. SLC Management’s 5-year average relative value to public benchmarks has been close to 90 bps.* Through June 30, 2020 we averaged 165 bps of relative value.
Through the first six months of 2020, we committed to $1.2 billion across 36 transactions. These transactions had a weighted average tenor of 15.7 years, average life of 11 years, rating of A3 and a spread of 327 bps.** We found strong value in all segments of the market, especially in the second quarter. Several broadly marketed corporate transactions offered relative value in excess of 100 bps, due to a higher than normal liquidity premium, and strong value was also obtained from transactions in SLC Management focus areas such as alternative asset managers, infrastructure and sustainability-related investments.
| YTD 2020 | Avg WAL | Avg rating | Avg spread |
|---|---|---|---|
Private placement market |
16 yrs | 51%: A 49%: BBB |
250 |
| SLC Management | 16 yrs | 60%: A 40%: BBB |
327 |
Outlook for the second half of 2020
The strength of the U.S. private placement market in the second half of 2020 will be influenced to a large degree by the economic and health impacts of the pandemic. Positive news related to Covid-19 coupled with ongoing fiscal and monetary support will buoy both the public and private credit markets. At this point, we expect to see solid deals through the summer as issuers capitalize on favorable conditions, with less certainty around volume heading into the second quarter and the U.S. presidential election.
In focus topic: ESG
Environmental, Social, and Governance (ESG) considerations are becoming more prominent in investment decisions. With growing demand from investors for ESG friendly assets, the investment grade private credit market offers investors unique access to investments with positive impact ranging from utility-scale solar and wind power projects to energy efficiency improvements at government and commercial buildings and campuses.
SLC Management has a longstanding history in sustainable investing. A substantial portion of our investment grade private credit assets under management – $12.2 billion as of December 31, 2019 – qualify as sustainable investments under the International Capital Markets (ICMA) standard. And new investments totaling $1.3 billion in 2019 were also sustainable, and included renewable and energy efficiency projects, green buildings, clean transportation, sustainable water management and access to essential services.
As an example, SLC Management was the sole investor in a $63 million energy savings performance contract for a U.S. federal government historical capitol building. This project will generate over 20 million pounds per annum of carbon emission reductions, which is equivalent to eliminating 4,318 cars or adding 16,814 acres of forest. In addition, we were also the sole investor in a family emergency homeless shelter in a major metropolitan area, evidencing our commitment to investments that provide strong social impacts as well as environmental benefits.

* The relative value over public benchmarks estimate is derived by comparing each loan’s spread at funding with a corresponding public corporate bond benchmark based on credit rating. Loans that are internally rated as “AA” are compared to the Bloomberg Barclays U.S. Corporate Aa Index, loans rated “A” are compared to the Bloomberg Barclays U.S. Corporate A Index, while loans rated “BBB” are compared to the Bloomberg Barclays U.S. Corporate Baa Index. For certain power and utility project loans, a best fit approach of a variety of Bloomberg Barclays’ indices was employed prior to September 30, 2016. After this date, these types of loans were compared to Bloomberg Barclays Utilities A Index and Bloomberg Barclays Utilities Baa Index, for “A” and “BBB” internally rated loans, respectively. Relative spread values obtained through the above methodologies were then aggregated and asset-weighted (by year) to obtain the overall spread value indicated in the paper.
** Investment grade credit ratings of our private placements portfolio are based on a proprietary, internal credit rating methodology that was developed using both externally-purchased and internally developed models. This methodology is reviewed regularly. More details can be shared upon request. Although most U.S. dollar private placement investments have an external rating, for unrated deals, there is no guarantee that the same rating(s) would be assigned to portfolio asset(s) if they were independently rated by a major credit ratings organization.
The information in this paper is not intended to provide specific financial, tax, investment, insurance, legal or accounting advice and should not be relied upon and does not constitute a specific offer to buy and/or sell securities, insurance or investment services. Investors should consult with their professional advisors before acting upon any information contained in this paper.
SLC Management is the brand name for the institutional asset management business of Sun Life Financial Inc. (“Sun Life”) under which Sun Life Capital Management (U.S.) LLC in the United States, and Sun Life Capital Management (Canada) Inc. in Canada operate. Sun Life Capital Management (Canada) Inc. is a Canadian registered portfolio manager, investment fund manager, exempt market dealer and in Ontario, a commodity trading manager. Sun Life Capital Management (U.S.) LLC is registered with the U.S. Securities and Exchange Commission as an investment adviser and is also a Commodity Trading Advisor and Commodity Pool Operator registered with the Commodity Futures Trading Commission under the Commodity Exchange Act and Members of the National Futures Association. Registration as an investment adviser does not imply any level of skill or training.
There is no assurance that the objective of any private placement strategy can be achieved. The principal risks associated with the Advisor’s private placement strategies are described as follows. As with any strategy, the Advisor’s judgments about the relative value of securities selected for the portfolio can prove to be wrong.
(1) Interest rate risk involves the risk that interest rates will go up, or the expected spread to the benchmark will widen, causing the value of the portfolio’s fixed income securities to go down. This risk can be greater for securities with longer maturities and the widening of spreads can continue for an extended period of time. (2) Credit risk is the risk that the issuer of fixed income securities will fail to meet its payment obligations or become insolvent causing the market value of the securities to decrease. Private placements are not rated by the credit rating agencies. Any ratings assigned to this debt is the product of analysis performed by the Advisor and or Advisor’s affiliates. (3) Liquidity risk is the risk that Advisor may be unable to sell a given security at an advantageous time or price or to purchase the desired level of exposure for the portfolio. At times this market has experienced severe illiquidity and/or significant price impacts. (4) Counterparty risk involves the risk that the opposing party in a transaction does not fulfill its commitments.
Unless otherwise stated, all figures and estimates provided have been sourced internally and are as of March 31, 2020. Unless otherwise noted, all references to “$” are in U.S. dollars.
An advisory fee reduces the investor’s return. For example, on a $100,000,000 investment, an investment advisory fee of $170,000 per year is deducted from the account. An account with a compounded annual total return of 10% would have increased by 159% over ten years. Assuming an annual advisory fee of 0.17%, this increase would be 155%. Information presented is based on data in U.S. dollars. The investment advisory fees are described in Part 2 of the Sun Life Capital Management (U.S.) LLC Form ADV.
This document may present materials or statements which reflect expectations or forecasts of future events. Such forward-looking statements are speculative in nature and may be subject to risks, uncertainties and assumptions and actual results which could differ significantly from the statements. As such, do not place undue reliance upon such forward-looking statements. All opinions and commentary are subject to change without notice and are provided in good faith without legal responsibility. Unless otherwise stated, all figures and estimates provided have been sourced internally and are current as at the date of the paper unless separately stated. All data is subject to change.
No part of this material may, without SLC Management’s prior written consent, be (i) copied, photocopied or duplicated in any form, by any means, or (ii) distributed to any person that is not an employee, officer, director, or authorized agent of the recipient.
© 2020, SLC Management