


Market
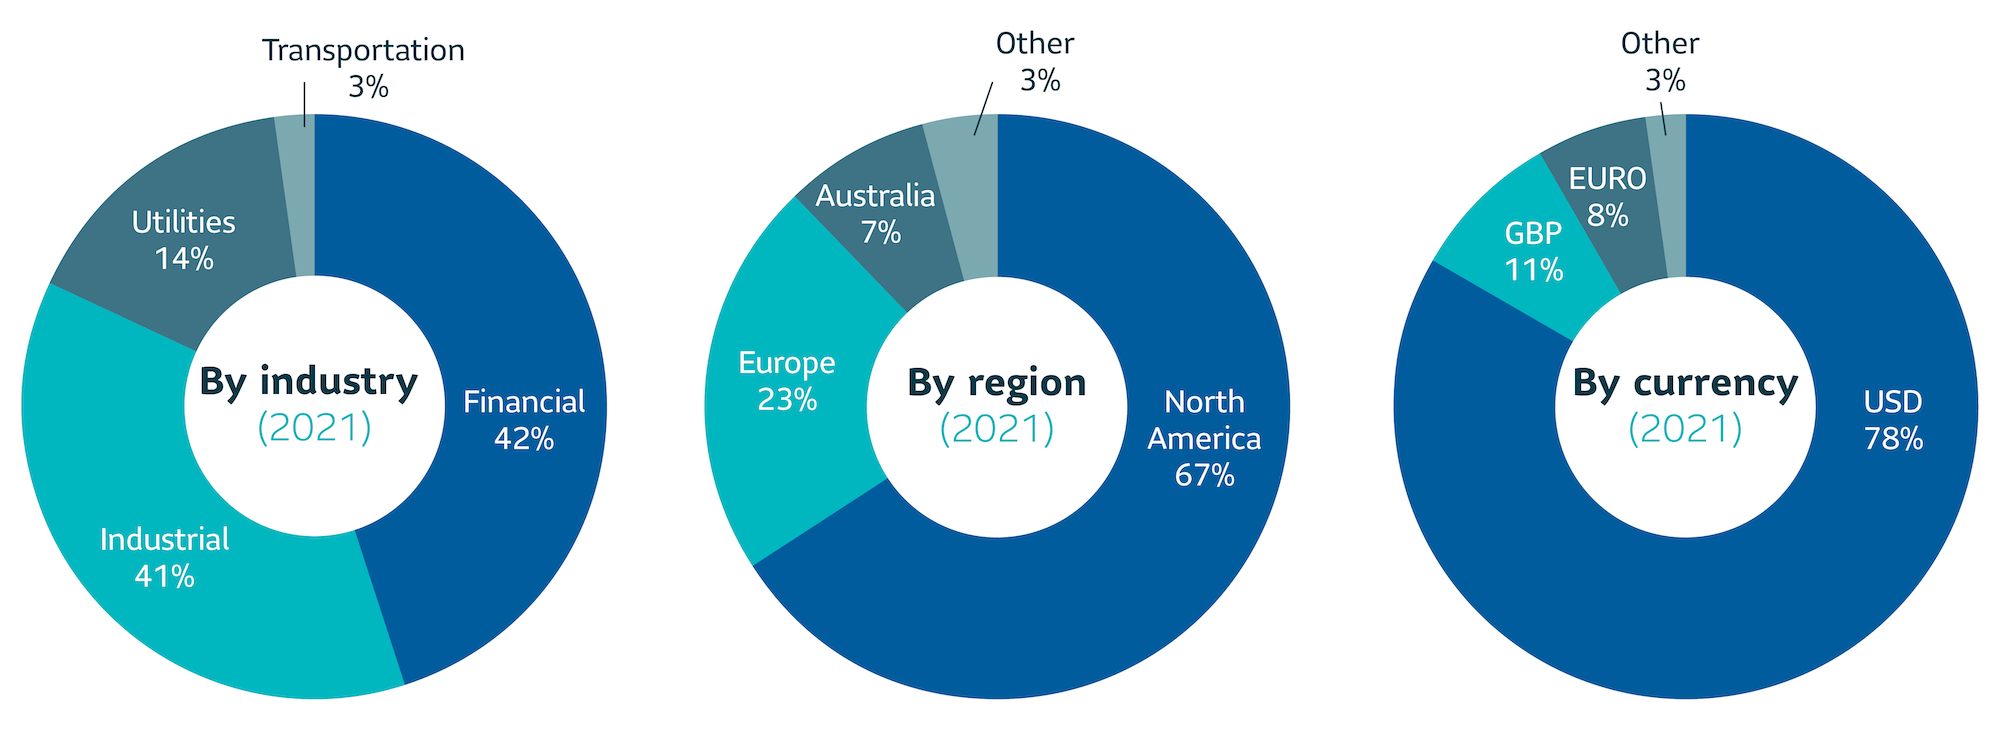
2021 was a record-breaking year for U.S. Private Placement market volume at $115 billion, beating the previous record of $105 billion set in 2020. Issuers continued to value the private investment grade debt market for its ability to provide customized financing solutions from a deep and growing pool of sophisticated investors. Reflective of the record volume, the strength and depth of the market in 2021 was evidenced by the record 18 transactions that were $1 billion or more in size. Financials (asset managers, REITs, investment companies) was the largest sector by volume at 42%, followed by Industrials at 41%, and Utilities at 14%. Issuance from alternative asset managers was a notable trend in 2021, driven by the increasing size of private equity funds and the need on the part of General Partners (GPs) to create balance sheet capacity for growth and investment opportunities.
Volume for 2021 was driven by domestic issuance, totaling approximately 67% of total market issuance, followed by UK/Europe at 23%. Transactions denominated in USD accounted for almost 80% of volume for the year. The volume of NAIC 1 (A- or better) credits versus NAIC 2 (BBB) was around 35%/65%, near its long-term average.
Private market spreads continued to grind tighter through the course of 2021, ending the year with about 75 basis points (bps) tighter compared to the end of 2020 and below pre-pandemic levels across most sectors. Allocations on broadly distributed deals continue to be challenging with issues well oversubscribed.
Outlook
While it will be difficult for 2022 to match the record volume year of 2021, the private placement market has proven its durability and we expect to see solid issuance. We expect to see attractive opportunities in sectors such as asset managers, infrastructure, and credit tenant leases. Competition is heating up with several new entrants into the Investment Grade Private Credit (IGPC) market, but SLC Management continues to see value in less competitive, bespoke markets where we can leverage our strong origination platform, sector expertise and longstanding relationships to maximize allocations.
| 2021 | Weighted average life | Average rating | Average Spread1 |
|---|---|---|---|
| Private placement market |
12 years | 37%: A 63%: BBB |
111 |
| SLC Management2 | 11 years | 51%:A 49%: BBB |
183 |
1 All commitments
2 SLC Management figures based on all commitments
Investment grade credit ratings of our private placement’s portfolio are based on a proprietary, internal credit rating methodology that was developed using both externally purchased and internally developed models. This methodology is reviewed regularly. More details can be shared upon request. Although most U.S. dollar private placement investments have an external rating, for unrated deals, there is no guarantee that the same rating(s) would be assigned to portfolio asset(s) if they were independently rated by a major credit ratings organization.
The relative value over public benchmarks estimate is derived by comparing each loan’s spread at funding with a corresponding public corporate bond benchmark based on credit rating. Loans that are internally rated as “AA” are compared to the Bloomberg Barclays U.S. Corporate Aa Index, loans rated “A” are compared to the Bloomberg Barclays U.S. Corporate A Index, while loans rated “BBB” are compared to the Bloomberg Barclays U.S. Corporate Baa Index. For certain power and utility project loans, a best fit approach of a variety of Bloomberg Barclays’ indices was employed prior to September 30, 2016. After this date, these types of loans were compared to Bloomberg Barclays Utilities A Index and Bloomberg Barclays Utilities Baa Index, for “A” and “BBB” internally rated loans, respectively. Relative spread values obtained through the above methodologies were then aggregated and asset-weighted (by year) to obtain the overall spread value indicated in the paper.
What a Year! What’s Next?
IGPC 2021
After an extremely active year in private credit markets, we look back at the major trends of 2021 and how they might impact the markets in 2022.
Issuance
2021 was a record year in terms of issuance. This was a continuation of the trend from 2020, where the market was busy after the first quarter. The story of issuance in 2021 was really the story of the financial sector, which accounted for almost 50% of new issuance. This was much higher than the typical 20 to 30% and was largely driven by private equity (PE) firms raising capital on their own balance sheets to support their investment activities.
In PE investments, GPs from the firm are typically required to invest alongside the clients (Limited Partners/LPs). As their funds grow – as was the case for many firms in 2021 – the amount of co-investment required from the GPs can become too large to be fulfilled solely by their personal wealth. As a result, firms have two choices in resolving this capital shortfall: they can either go public and raise capital, or they can remain private and bridge the funding gap via private credit. In 2021, we saw multiple deals over $1 billion in size from firms who chose to stay private. We expect the trend to continue, filtering down to smaller sized PE firms with smaller sized deals.
The financial sector issuance has been higher in quality, in the A/AA- range, as opposed to the normal A/BBB range of the broader market. The deals are mostly unsecured and are not drastically different in terms of covenants or leverage. They are typically liquid, especially those that are financed by large household names where it’s easy to find buyers in the secondary market. The key difference we saw in financial issuance was that debt from these issuers tended to be shorter in duration. This hit a sweet spot in the market in 2021, as we also saw an increase in shorter duration buyers entering the market.
New buyers
Traditionally, the investment grade private credit market has been dominated by large life insurers. However, in 2021, we saw a noticeable increase in investment grade private credit adoption from both small and mid-sized life insurers and property and casualty (P&C) insurers, as well as from pension plan sponsors looking to increase yield and diversify their liability hedging portfolios.
In an increasingly competitive market, more insurers are looking to outsource the management of their IGPC allocations to firms that specialize in this area. This allows them to utilize the credit investment capabilities and scale of an investor like SLC Management and gain access to unique deals that are not widely available. While life insurers have typically focused on the long end of the market, P&C insurers often prefer shorter duration allocations that better align with the terms of their liabilities. We’ve also seen a greater focus on liquidity management due to the less predictable nature of their cashflow requirements. The key thread linking the new investors together is the low rate environment which has significantly increased the pressure to maintain book yield. While larger insurers typically access the asset class through separate accounts, we have seen smaller insurers look to access IGPC through pooled investment vehicles, where the yield advantage outweighs the additional charges of the pooled investment vehicle.
On the pension front, in 2021 we saw a strong trend towards additional diversification within liability hedging portfolios. For many plan sponsors, IGPC was a natural first step due to its high-quality nature and the correlation of IGPC yields to liability discount rates. The ability to access issuers, sectors, and structures not readily available in the traditional corporate bond universe provided a natural extension to existing bond portfolios. Life insurers have long used this asset class to back pension liabilities in buyout transactions, and we are increasingly seeing the asset class adopted by both early and late stage plans, as well as through many of the larger outsourced CIO (OCIO) providers.
We also saw an increased interest in intermediate duration IGPC from plan sponsors who were looking to hedge shorter duration cashflows, as well as those looking to take advantage of the additional relative value on offer in this sometimes underserved part of the IGPC yield curve. For most pensions, a pooled investment vehicle structure that provides additional liquidity as well as a daily mark-to-market valuation provides a more attractive method for gaining exposure.
Thoughts for 2022
At over $110BN, 2021 will likely stand as a record year. While the market remains robust and continues to grow, it is hard to believe that 2022 will outperform that high bar. Nevertheless, we expect a solid year of activity from the markets, albeit at a slightly diminished pace from the frantic 2021. Similarly, we expect financials issuance to continue to be above historical average, but likely not as high as 2021.
In terms of demand, we expect to see a continuation from 2021. Persistent low yields are likely to continue to drive interest from insurance companies looking to maintain the book yield on their portfolios. We expect pensions to continue allocating to IGPC, as more investors move from educating themselves on the asset class and evaluating managers to implementing mandates. With several OCIO providers adding IGPC to their pooled investment vehicle lineups – either within existing vehicles or as standalone options – the asset class will continue to become more accessible to a wider swath of investors.
We also see some exciting new areas of interest and opportunity. There is a trend towards the adoption of alternatives in 401(k) plans, and we expect this to extend to IGPC in the near term. Real estate vehicles are now common options in defined contribution (DC) plans, and private equity is increasingly available. We believe IGPC is a natural addition for DC plans in this low rate environment, however plan sponsors should be aware of some of the operational challenges around benchmarking and daily valuation, and work with managers that have products designed specifically for this space.
At SLC Management we specialize in managing investment grade private credit for a variety of investors, offering several investment vehicles and tailored solutions to meet their risk, return and duration needs.
Data presented in this article has been calculated internally based on external market data sourced from Private Placement Monitor.
Investment grade credit ratings of our private placement’s portfolio are based on a proprietary, internal credit rating methodology that was developed using both externally purchased and internally developed models. This methodology is reviewed regularly. More details can be shared upon request. Although most U.S. dollar private placement investments have an external rating, for unrated deals, there is no guarantee that the same rating(s) would be assigned to portfolio asset(s) if they were independently rated by a major credit ratings organization.
The information in this paper is not intended to provide specific financial, tax, investment, insurance, legal or accounting advice and should not be relied upon and does not constitute a specific offer to buy and/or sell securities, insurance or investment services. Investors should consult with their professional advisors before acting upon any information contained in this paper.
SLC Management is the brand name for the institutional asset management business of Sun Life Financial Inc. (“Sun Life”) under which Sun Life Capital Management (U.S.) LLC in the United States, and Sun Life Capital Management (Canada) Inc. in Canada operate. Sun Life Capital Management (Canada) Inc. is a Canadian registered portfolio manager, investment fund manager, exempt market dealer and in Ontario, a commodity trading manager. Sun Life Capital Management (U.S.) LLC is registered with the U.S. Securities and Exchange Commission as an investment adviser and is also a Commodity Trading Advisor and Commodity Pool Operator registered with the Commodity Futures Trading Commission under the Commodity Exchange Act and Members of the National Futures Association. Registration as an investment adviser does not imply any level of skill or training. There is no assurance that the objective of any private placement strategy can be achieved. As with any strategy, the Advisor’s judgments about the relative value of securities selected for the portfolio can prove to be wrong.
The relative value over public benchmarks estimate is derived by comparing each loan’s spread at funding with a corresponding public corporate bond benchmark based on credit rating. Loans that are internally rated as “AA” are compared to the Bloomberg Barclays U.S. Corporate Aa Index, loans rated “A” are compared to the Bloomberg Barclays U.S. Corporate A Index, while loans rated “BBB” are compared to the Bloomberg Barclays U.S. Corporate Baa Index. For certain power and utility project loans, a best fit approach of a variety of Bloomberg Barclays’ indices was employed prior to September 30, 2016. After this date, these types of loans were compared to Bloomberg Barclays Utilities A Index and Bloomberg Barclays Utilities Baa Index, for “A” and “BBB” internally rated loans, respectively. Relative spread values obtained through the above methodologies were then aggregated and asset-weighted (by year) to obtain the overall spread value indicated in the paper.
Unless otherwise stated, all figures and estimates provided have been sourced internally and are as of September 30, 2021. Unless otherwise noted, all references to “$” are in U.S. dollars.
This document may present materials or statements which reflect expectations or forecasts of future events. Such forward-looking statements are speculative in nature and may be subject to risks, uncertainties and assumptions and actual results which could differ significantly from the statements. As such, do not place undue reliance upon such forward-looking statements. All opinions and commentary are subject to change without notice and are provided in good faith without legal responsibility. Unless otherwise stated, all figures and estimates provided have been sourced internally and are current as at the date of the paper unless separately stated. All data is subject to change.
No part of this material may, without SLC Management’s prior written consent, be (i) copied, photocopied or duplicated in any form, by any means, or (ii) distributed to any person that is not an employee, officer, director, or authorized agent of the recipient.
© 2022, SLC Management